1. The implementation of standard causal inference aproaches in R

Author

Kuan Liu

Published

2024-10-12

Outlines
  • Descriptive analysis
  • Propensity score matching
  • Propensity score weighting
  • General guideline on PSA analysis

0. Summary statistics of baseline variables by treatment status

require(tidyverse)
library(tableone)
data2<-readRDS("data/data2")
covariates <- select(data2, -c(id, A, Y))
baselines <- colnames(covariates)
baselines
 [1] "cat1"     "ca"       "cardiohx" "chfhx"    "dementhx" "psychhx" 
 [7] "chrpulhx" "renalhx"  "liverhx"  "gibledhx" "malighx"  "immunhx" 
[13] "transhx"  "amihx"    "age"      "sex"      "edu"      "aps1"    
[19] "scoma1"   "meanbp1"  "wblc1"    "hrt1"     "resp1"    "temp1"   
[25] "pafi1"    "alb1"     "hema1"    "bili1"    "crea1"    "sod1"    
[31] "pot1"     "paco21"   "ph1"      "wtkilo1"  "dnr1"     "ninsclas"
[37] "resp"     "card"     "neuro"    "gastr"    "renal"    "meta"    
[43] "hema"     "seps"     "trauma"   "ortho"    "race"     "income"  
tab0 <- CreateTableOne(vars = baselines,
                       data = data2, 
                       strata = "A", 
                       test = FALSE, #mute P-value calculation;
                       smd = TRUE,
                       addOverall = TRUE)
print(tab0, smd = TRUE, showAllLevels = FALSE)
                        Stratified by A
                         Overall         0               1               SMD   
  n                        5735            3551            2184                
  cat1 (%)                                                                0.583
     ARF                   2490 (43.4)     1581 (44.5)      909 (41.6)         
     CHF                    456 ( 8.0)      247 ( 7.0)      209 ( 9.6)         
     Cirrhosis              224 ( 3.9)      175 ( 4.9)       49 ( 2.2)         
     Colon Cancer             7 ( 0.1)        6 ( 0.2)        1 ( 0.0)         
     Coma                   436 ( 7.6)      341 ( 9.6)       95 ( 4.3)         
     COPD                   457 ( 8.0)      399 (11.2)       58 ( 2.7)         
     Lung Cancer             39 ( 0.7)       34 ( 1.0)        5 ( 0.2)         
     MOSF w/Malignancy      399 ( 7.0)      241 ( 6.8)      158 ( 7.2)         
     MOSF w/Sepsis         1227 (21.4)      527 (14.8)      700 (32.1)         
  ca (%)                                                                  0.107
     Metastatic             384 ( 6.7)      261 ( 7.4)      123 ( 5.6)         
     No                    4379 (76.4)     2652 (74.7)     1727 (79.1)         
     Yes                    972 (16.9)      638 (18.0)      334 (15.3)         
  cardiohx (mean (SD))     0.18 (0.38)     0.16 (0.37)     0.20 (0.40)    0.116
  chfhx (mean (SD))        0.18 (0.38)     0.17 (0.37)     0.19 (0.40)    0.069
  dementhx (mean (SD))     0.10 (0.30)     0.12 (0.32)     0.07 (0.25)    0.163
  psychhx (mean (SD))      0.07 (0.25)     0.08 (0.27)     0.05 (0.21)    0.143
  chrpulhx (mean (SD))     0.19 (0.39)     0.22 (0.41)     0.14 (0.35)    0.192
  renalhx (mean (SD))      0.04 (0.21)     0.04 (0.20)     0.05 (0.21)    0.032
  liverhx (mean (SD))      0.07 (0.26)     0.07 (0.26)     0.06 (0.24)    0.049
  gibledhx (mean (SD))     0.03 (0.18)     0.04 (0.19)     0.02 (0.16)    0.070
  malighx (mean (SD))      0.23 (0.42)     0.25 (0.43)     0.20 (0.40)    0.101
  immunhx (mean (SD))      0.27 (0.44)     0.26 (0.44)     0.29 (0.45)    0.080
  transhx (mean (SD))      0.12 (0.32)     0.09 (0.29)     0.15 (0.36)    0.170
  amihx (mean (SD))        0.03 (0.18)     0.03 (0.17)     0.04 (0.20)    0.074
  age (mean (SD))         61.38 (16.68)   61.76 (17.29)   60.75 (15.63)   0.061
  sex = Male (%)           3192 (55.7)     1914 (53.9)     1278 (58.5)    0.093
  edu (mean (SD))         11.68 (3.15)    11.57 (3.13)    11.86 (3.16)    0.091
  aps1 (mean (SD))        54.67 (19.96)   50.93 (18.81)   60.74 (20.27)   0.501
  scoma1 (mean (SD))      21.00 (30.27)   22.25 (31.37)   18.97 (28.26)   0.110
  meanbp1 (mean (SD))     78.52 (38.05)   84.87 (38.87)   68.20 (34.24)   0.455
  wblc1 (mean (SD))       15.65 (11.87)   15.26 (11.41)   16.27 (12.55)   0.084
  hrt1 (mean (SD))       115.18 (41.24)  112.87 (40.94)  118.93 (41.47)   0.147
  resp1 (mean (SD))       28.09 (14.08)   28.98 (13.95)   26.65 (14.17)   0.165
  temp1 (mean (SD))       37.62 (1.77)    37.63 (1.74)    37.59 (1.83)    0.021
  pafi1 (mean (SD))      222.27 (114.95) 240.63 (116.66) 192.43 (105.54)  0.433
  alb1 (mean (SD))         3.09 (0.78)     3.16 (0.67)     2.98 (0.93)    0.230
  hema1 (mean (SD))       31.87 (8.36)    32.70 (8.79)    30.51 (7.42)    0.269
  bili1 (mean (SD))        2.27 (4.80)     2.00 (4.43)     2.71 (5.33)    0.145
  crea1 (mean (SD))        2.13 (2.05)     1.92 (2.03)     2.47 (2.05)    0.270
  sod1 (mean (SD))       136.77 (7.66)   137.04 (7.68)   136.33 (7.60)    0.092
  pot1 (mean (SD))         4.07 (1.03)     4.08 (1.04)     4.05 (1.01)    0.027
  paco21 (mean (SD))      38.75 (13.18)   39.95 (14.24)   36.79 (10.97)   0.249
  ph1 (mean (SD))          7.39 (0.11)     7.39 (0.11)     7.38 (0.11)    0.120
  wtkilo1 (mean (SD))     67.83 (29.06)   65.04 (29.50)   72.36 (27.73)   0.256
  dnr1 = Yes (%)            654 (11.4)      499 (14.1)      155 ( 7.1)    0.228
  ninsclas (%)                                                            0.194
     Medicaid               647 (11.3)      454 (12.8)      193 ( 8.8)         
     Medicare              1458 (25.4)      947 (26.7)      511 (23.4)         
     Medicare & Medicaid    374 ( 6.5)      251 ( 7.1)      123 ( 5.6)         
     No insurance           322 ( 5.6)      186 ( 5.2)      136 ( 6.2)         
     Private               1698 (29.6)      967 (27.2)      731 (33.5)         
     Private & Medicare    1236 (21.6)      746 (21.0)      490 (22.4)         
  resp = Yes (%)           2113 (36.8)     1481 (41.7)      632 (28.9)    0.270
  card = Yes (%)           1931 (33.7)     1007 (28.4)      924 (42.3)    0.295
  neuro = Yes (%)           693 (12.1)      575 (16.2)      118 ( 5.4)    0.353
  gastr = Yes (%)           942 (16.4)      522 (14.7)      420 (19.2)    0.121
  renal = Yes (%)           295 ( 5.1)      147 ( 4.1)      148 ( 6.8)    0.116
  meta = Yes (%)            265 ( 4.6)      172 ( 4.8)       93 ( 4.3)    0.028
  hema = Yes (%)            354 ( 6.2)      239 ( 6.7)      115 ( 5.3)    0.062
  seps = Yes (%)           1031 (18.0)      515 (14.5)      516 (23.6)    0.234
  trauma = Yes (%)           52 ( 0.9)       18 ( 0.5)       34 ( 1.6)    0.104
  ortho = Yes (%)             7 ( 0.1)        3 ( 0.1)        4 ( 0.2)    0.027
  race (%)                                                                0.036
     black                  920 (16.0)      585 (16.5)      335 (15.3)         
     other                  355 ( 6.2)      213 ( 6.0)      142 ( 6.5)         
     white                 4460 (77.8)     2753 (77.5)     1707 (78.2)         
  income (%)                                                              0.142
     $11-$25k              1165 (20.3)      713 (20.1)      452 (20.7)         
     $25-$50k               893 (15.6)      500 (14.1)      393 (18.0)         
     > $50k                 451 ( 7.9)      257 ( 7.2)      194 ( 8.9)         
     Under $11k            3226 (56.3)     2081 (58.6)     1145 (52.4)         

0.1 Naive regression analysis

library(sjPlot)
# adjust the treatment variable & baseline variables;
fit0.Y.formula <- as.formula(paste("Y ~ A +", 
                               paste(baselines, 
                                     collapse = "+")))
fit0 <- glm(fit0.Y.formula, family = "binomial", data = data2)
tab_model(fit0)
  Y
Predictors Odds Ratios CI p
(Intercept) 1.84 0.00 – 681.93 0.841
A 1.42 1.23 – 1.64 <0.001
cat1 [CHF] 0.62 0.43 – 0.89 0.010
cat1 [Cirrhosis] 1.28 0.82 – 1.98 0.271
cat1 [Colon Cancer] 0.08 0.00 – 0.78 0.048
cat1 [Coma] 3.90 2.92 – 5.25 <0.001
cat1 [COPD] 0.59 0.42 – 0.83 0.002
cat1 [Lung Cancer] 2.04 0.94 – 4.31 0.064
cat1 [MOSF w/Malignancy] 1.67 1.25 – 2.24 0.001
cat1 [MOSF w/Sepsis] 1.02 0.85 – 1.22 0.819
ca [No] 0.40 0.18 – 0.87 0.021
ca [Yes] 0.86 0.64 – 1.14 0.289
cardiohx 1.02 0.84 – 1.23 0.857
chfhx 1.06 0.86 – 1.29 0.586
dementhx 1.11 0.90 – 1.37 0.330
psychhx 0.79 0.61 – 1.03 0.092
chrpulhx 1.07 0.88 – 1.29 0.523
renalhx 1.28 0.89 – 1.82 0.180
liverhx 1.34 0.93 – 1.93 0.110
gibledhx 1.22 0.80 – 1.87 0.357
malighx 0.61 0.30 – 1.23 0.165
immunhx 1.08 0.94 – 1.25 0.290
transhx 1.17 0.96 – 1.43 0.112
amihx 0.74 0.52 – 1.05 0.099
age 1.01 1.01 – 1.02 <0.001
sex [Male] 1.10 0.96 – 1.25 0.167
edu 1.00 0.98 – 1.02 0.854
aps1 1.02 1.01 – 1.02 <0.001
scoma1 1.01 1.01 – 1.01 <0.001
meanbp1 1.00 1.00 – 1.00 0.120
wblc1 1.00 0.99 – 1.00 0.448
hrt1 1.00 1.00 – 1.00 0.042
resp1 1.00 0.99 – 1.00 0.064
temp1 0.97 0.93 – 1.01 0.107
pafi1 1.00 1.00 – 1.00 0.004
alb1 0.96 0.87 – 1.05 0.395
hema1 1.00 0.99 – 1.01 0.915
bili1 1.06 1.05 – 1.08 <0.001
crea1 0.97 0.93 – 1.02 0.207
sod1 0.99 0.98 – 1.00 0.071
pot1 1.00 0.94 – 1.07 0.964
paco21 1.00 0.99 – 1.00 0.303
ph1 0.90 0.43 – 1.88 0.770
wtkilo1 1.00 1.00 – 1.00 0.444
dnr1 [Yes] 3.00 2.47 – 3.65 <0.001
ninsclas [Medicare] 1.42 1.09 – 1.85 0.010
ninsclas [Medicare &
Medicaid]
1.20 0.87 – 1.67 0.270
ninsclas [No insurance] 1.66 1.19 – 2.31 0.003
ninsclas [Private] 1.28 1.00 – 1.64 0.053
ninsclas [Private &
Medicare]
1.26 0.96 – 1.65 0.103
resp [Yes] 1.19 1.01 – 1.40 0.037
card [Yes] 0.98 0.83 – 1.15 0.780
neuro [Yes] 1.33 1.05 – 1.69 0.017
gastr [Yes] 1.13 0.92 – 1.39 0.233
renal [Yes] 0.96 0.72 – 1.29 0.800
meta [Yes] 0.78 0.57 – 1.06 0.116
hema [Yes] 1.91 1.46 – 2.49 <0.001
seps [Yes] 0.98 0.82 – 1.18 0.862
trauma [Yes] 0.94 0.45 – 1.85 0.866
ortho [Yes] 0.45 0.02 – 2.87 0.470
race [other] 1.08 0.80 – 1.46 0.610
race [white] 1.04 0.86 – 1.25 0.712
income [$25-$50k] 0.83 0.66 – 1.03 0.089
income [> $50k] 0.82 0.62 – 1.08 0.166
income [Under $11k] 1.17 0.99 – 1.39 0.071
Observations 5735
R2 Tjur 0.205

1 Propensity score analysis

  • This is a review from the morning session. See Brice’s lecture notes for details.

1.1 Propensity score matching

library(MatchIt)

set.seed(123) #this approach requires setting seed values to reproduce the same results;

ps.formula <- as.formula(paste("A~", 
                paste(baselines, collapse = "+")))


# we can select variables caliper to ensure large/representable matched pairs are selected;
# caliper can take values between 0.05 (a tight match) to 0.2 (a loose match);

match.obj <- matchit(ps.formula, data =data2,
                     distance = 'logit', #default glm/logistic PS estimation;
                     method = "nearest", #nearest neighbour;
                     replace=FALSE,
                     ratio = 1, #1:1 match;
                     caliper = .15)

Checking PS distributions and balance

library(cobalt)
bal.plot(match.obj,
         var.name="distance",
         which="both",
         type = "density",
         colors = c("red","blue"))

love.plot(match.obj, 
          binary = "std", 
          grid = TRUE,
          thresholds = c(m = .1),
          colors = c("red","blue"))  

Outcome regression post-matching

library(geepack)
Match <- match.data(match.obj)
fit1 <- geeglm(Y ~ A, family=binomial("log"), 
              data=Match,
              weights=weights, 
              std.err = 'san.se', 
              id=subclass, 
              corstr="independence") 
sjPlot::tab_model(fit1)
  Y
Predictors Risk Ratios CI p
(Intercept) 0.30 0.28 – 0.33 <0.001
A 1.23 1.12 – 1.36 <0.001
N subclass 1635
Observations 3270

1.2 Propensity score weighting

Obtaining weights using WeightIt package

library(WeightIt)
IPTW <- weightit(ps.formula,
                 data = data2,
                 method = "glm", #using the default logistic regression;
                 stabilize = TRUE,
                 estimand = "ATE")

IPTW
A weightit object
 - method: "glm" (propensity score weighting with GLM)
 - number of obs.: 5735
 - sampling weights: none
 - treatment: 2-category
 - estimand: ATE
 - covariates: cat1, ca, cardiohx, chfhx, dementhx, psychhx, chrpulhx, renalhx, liverhx, gibledhx, malighx, immunhx, transhx, amihx, age, sex, edu, aps1, scoma1, meanbp1, wblc1, hrt1, resp1, temp1, pafi1, alb1, hema1, bili1, crea1, sod1, pot1, paco21, ph1, wtkilo1, dnr1, ninsclas, resp, card, neuro, gastr, renal, meta, hema, seps, trauma, ortho, race, income
summary(IPTW)
                  Summary of weights

- Weight ranges:

           Min                                   Max
treated 0.3893 |---------------------------| 19.6399
control 0.6206 |--------------|              11.4347

- Units with the 5 most extreme weights by group:
                                              
            795   4885    1825    3828    4890
 treated 7.5334 7.9065  8.0164  8.5311 19.6399
           2174   4007     505    3216    2986
 control 8.8226  9.686 10.0262 10.1506 11.4347

- Weight statistics:

        Coef of Var   MAD Entropy # Zeros
treated       0.959 0.522   0.258       0
control       0.622 0.339   0.117       0

- Effective Sample Sizes:

           Control Treated
Unweighted 3551.   2184.  
Weighted   2561.57 1137.96

Checking PS distributions and balance

bal.plot(IPTW,
         which="both",
         type = "density",
         colors = c("red","blue"))

bal.tab(IPTW, un=TRUE, thresholds = c(m=0.1))
Balance Measures
                                 Type Diff.Un Diff.Adj    M.Threshold
prop.score                   Distance  1.1831   0.0353 Balanced, <0.1
cat1_ARF                       Binary -0.0290   0.0099 Balanced, <0.1
cat1_CHF                       Binary  0.0261   0.0013 Balanced, <0.1
cat1_Cirrhosis                 Binary -0.0268  -0.0025 Balanced, <0.1
cat1_Colon Cancer              Binary -0.0012  -0.0004 Balanced, <0.1
cat1_Coma                      Binary -0.0525   0.0007 Balanced, <0.1
cat1_COPD                      Binary -0.0858  -0.0135 Balanced, <0.1
cat1_Lung Cancer               Binary -0.0073  -0.0033 Balanced, <0.1
cat1_MOSF w/Malignancy         Binary  0.0045   0.0023 Balanced, <0.1
cat1_MOSF w/Sepsis             Binary  0.1721   0.0054 Balanced, <0.1
ca_Metastatic                  Binary -0.0172  -0.0021 Balanced, <0.1
ca_No                          Binary  0.0439   0.0005 Balanced, <0.1
ca_Yes                         Binary -0.0267   0.0017 Balanced, <0.1
cardiohx                       Binary  0.0445   0.0048 Balanced, <0.1
chfhx                          Binary  0.0268   0.0000 Balanced, <0.1
dementhx                       Binary -0.0472  -0.0127 Balanced, <0.1
psychhx                        Binary -0.0348  -0.0033 Balanced, <0.1
chrpulhx                       Binary -0.0737  -0.0066 Balanced, <0.1
renalhx                        Binary  0.0066   0.0023 Balanced, <0.1
liverhx                        Binary -0.0124   0.0005 Balanced, <0.1
gibledhx                       Binary -0.0122  -0.0026 Balanced, <0.1
malighx                        Binary -0.0423  -0.0004 Balanced, <0.1
immunhx                        Binary  0.0358  -0.0019 Balanced, <0.1
transhx                        Binary  0.0554   0.0053 Balanced, <0.1
amihx                          Binary  0.0139   0.0011 Balanced, <0.1
age                           Contin. -0.0614  -0.0015 Balanced, <0.1
sex_Male                       Binary  0.0462   0.0142 Balanced, <0.1
edu                           Contin.  0.0914   0.0094 Balanced, <0.1
aps1                          Contin.  0.5014   0.0240 Balanced, <0.1
scoma1                        Contin. -0.1098  -0.0116 Balanced, <0.1
meanbp1                       Contin. -0.4551  -0.0030 Balanced, <0.1
wblc1                         Contin.  0.0836   0.0498 Balanced, <0.1
hrt1                          Contin.  0.1469   0.0305 Balanced, <0.1
resp1                         Contin. -0.1655   0.0120 Balanced, <0.1
temp1                         Contin. -0.0214   0.0030 Balanced, <0.1
pafi1                         Contin. -0.4332  -0.0017 Balanced, <0.1
alb1                          Contin. -0.2299  -0.0189 Balanced, <0.1
hema1                         Contin. -0.2693  -0.0321 Balanced, <0.1
bili1                         Contin.  0.1446  -0.0080 Balanced, <0.1
crea1                         Contin.  0.2696   0.0198 Balanced, <0.1
sod1                          Contin. -0.0922  -0.0124 Balanced, <0.1
pot1                          Contin. -0.0271  -0.0259 Balanced, <0.1
paco21                        Contin. -0.2486  -0.0276 Balanced, <0.1
ph1                           Contin. -0.1198   0.0167 Balanced, <0.1
wtkilo1                       Contin.  0.2557   0.0202 Balanced, <0.1
dnr1_Yes                       Binary -0.0696  -0.0105 Balanced, <0.1
ninsclas_Medicaid              Binary -0.0395   0.0046 Balanced, <0.1
ninsclas_Medicare              Binary -0.0327  -0.0136 Balanced, <0.1
ninsclas_Medicare & Medicaid   Binary -0.0144   0.0009 Balanced, <0.1
ninsclas_No insurance          Binary  0.0099   0.0002 Balanced, <0.1
ninsclas_Private               Binary  0.0624   0.0041 Balanced, <0.1
ninsclas_Private & Medicare    Binary  0.0143   0.0037 Balanced, <0.1
resp_Yes                       Binary -0.1277  -0.0096 Balanced, <0.1
card_Yes                       Binary  0.1395   0.0084 Balanced, <0.1
neuro_Yes                      Binary -0.1079  -0.0077 Balanced, <0.1
gastr_Yes                      Binary  0.0453   0.0002 Balanced, <0.1
renal_Yes                      Binary  0.0264   0.0049 Balanced, <0.1
meta_Yes                       Binary -0.0059   0.0010 Balanced, <0.1
hema_Yes                       Binary -0.0146   0.0013 Balanced, <0.1
seps_Yes                       Binary  0.0912   0.0054 Balanced, <0.1
trauma_Yes                     Binary  0.0105   0.0011 Balanced, <0.1
ortho_Yes                      Binary  0.0010   0.0002 Balanced, <0.1
race_black                     Binary -0.0114   0.0057 Balanced, <0.1
race_other                     Binary  0.0050  -0.0026 Balanced, <0.1
race_white                     Binary  0.0063  -0.0032 Balanced, <0.1
income_$11-$25k                Binary  0.0062  -0.0081 Balanced, <0.1
income_$25-$50k                Binary  0.0391   0.0051 Balanced, <0.1
income_> $50k                  Binary  0.0165   0.0013 Balanced, <0.1
income_Under $11k              Binary -0.0618   0.0017 Balanced, <0.1

Balance tally for mean differences
                   count
Balanced, <0.1        69
Not Balanced, >0.1     0

Variable with the greatest mean difference
 Variable Diff.Adj    M.Threshold
    wblc1   0.0498 Balanced, <0.1

Effective sample sizes
           Control Treated
Unadjusted 3551.   2184.  
Adjusted   2561.57 1137.96
love.plot(IPTW, 
          binary = "std", 
          grid = TRUE,
          thresholds = c(m = .1),
          colors = c("red","blue"))  

Outcome modelling

fit2 <- glm_weightit(Y ~ A, 
            family = "binomial",
            weightit = IPTW,
            data = data2)


tab_model(fit2)
  Y
Predictors Odds Ratios CI p
(Intercept) 0.45 0.41 – 0.49 <0.001
A 1.30 1.14 – 1.48 <0.001
Observations 5735
R2 Tjur 0.005
#To get Relative Risk we can use marginaleffect package;
library(marginaleffects)
avg_comparisons(fit2,
                variables = "A",
                comparison = "lnratioavg", #converting OR to RR;
                transform = "exp")

 Term              Contrast Estimate Pr(>|z|)    S 2.5 % 97.5 %
    A ln(mean(1) / mean(0))     1.19   <0.001 13.9  1.09   1.29

Columns: term, contrast, estimate, p.value, s.value, conf.low, conf.high, predicted_lo, predicted_hi, predicted 
Type:  response 

1.3 General guildelines on implementing PSA

Here providing a list a references that covers guildelines are PSA analysis and its reporting

  1. PS matching (Austin 2007)
  2. PSA analysis for cancer research (Yao et al. 2017)
  3. PSA analysis for neurology (Austin et al. 2021)
  4. PSA analysis for multiple sclerosis (Karim et al. 2022)

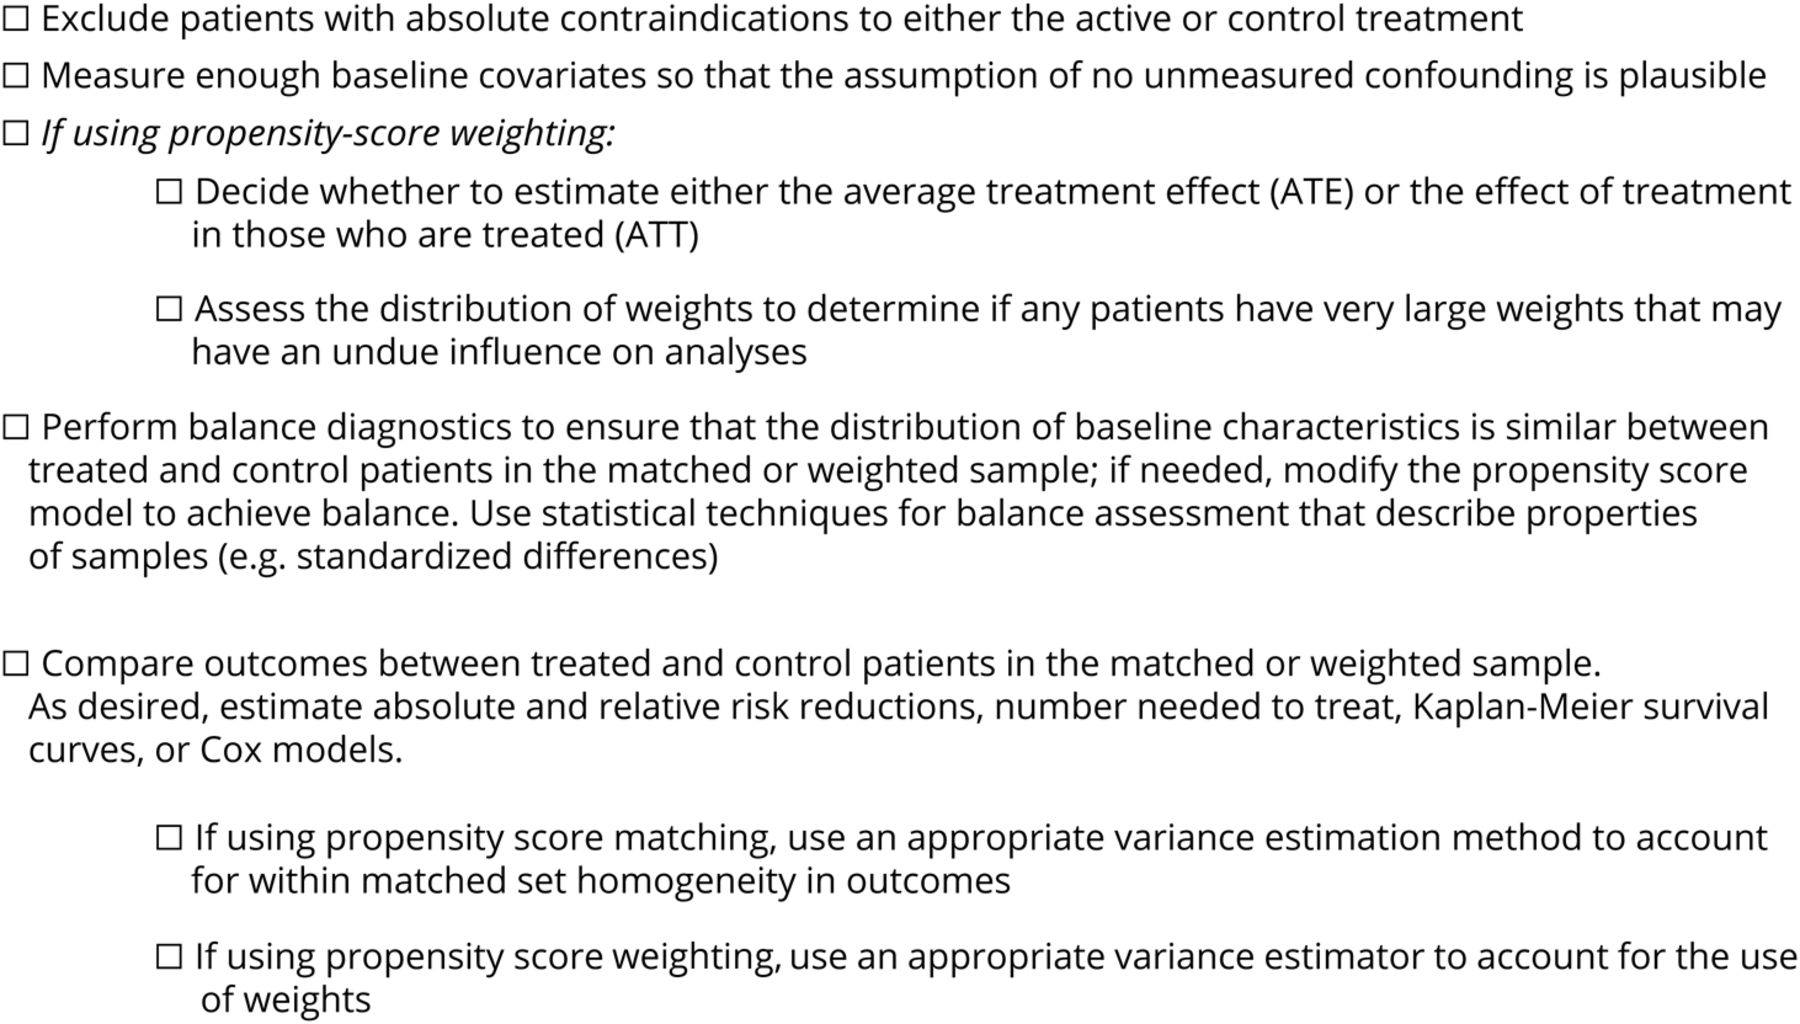
Checklist for the design and analysis of studies using PS methods

(Austin et al. 2021)

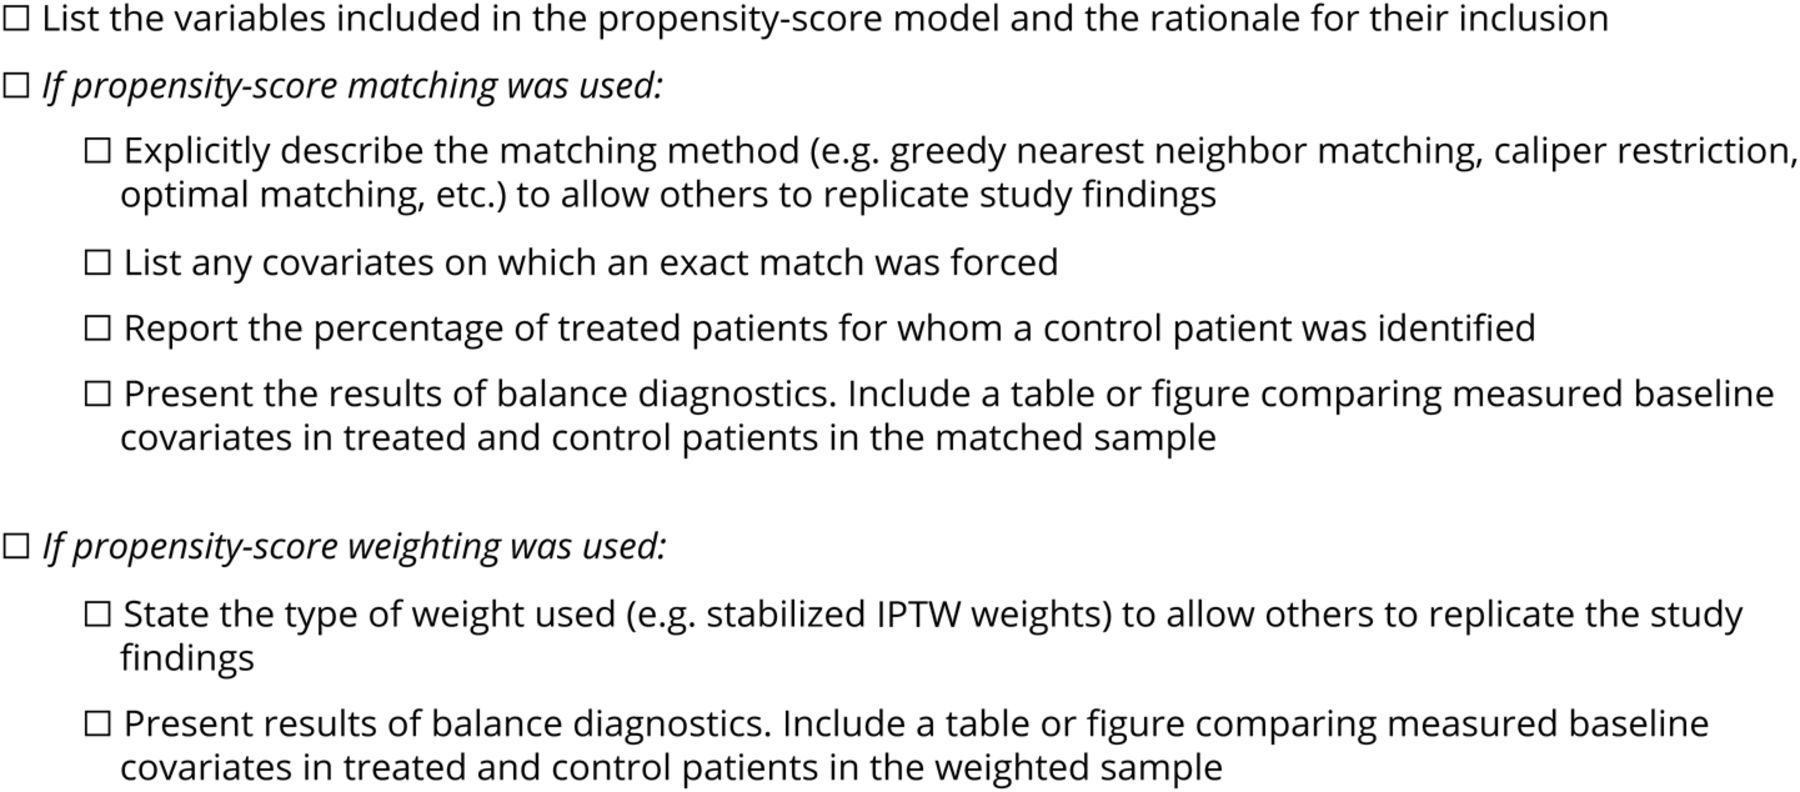
Checklist for reporting of studies using PS methods

(Austin et al. 2021)

Subgroup analysis - There are several good resources on how to estimate subgroup treatment effects:(Eeren et al. 2015), (Wang et al. 2018), (Dong et al. 2020),(Yang et al. 2021)

  • The Subgroup Balancing Propensity Score approach from (Dong et al. 2020) has been incorporated in the WeightIt package.
# example subgroup analysis by sex;
(fit2<- weightit(treat ~ age + educ + married +
                nodegree + race + re74, data = lalonde,
                method = "glm", estimand = "ATT"))
A weightit object
 - method: "glm" (propensity score weighting with GLM)
 - number of obs.: 614
 - sampling weights: none
 - treatment: 2-category
 - estimand: ATT (focal: 1)
 - covariates: age, educ, married, nodegree, race, re74
IPTW_sex <- weightit(ps.formula,
                 data = data2,
                 method = "glm", #using the default logistic regression;
                 by = "sex",
                 stabilize = TRUE)

subgroup_sex <- sbps(IPTW, IPTW_sex)
summary(subgroup_sex)
Summary of weights:

 - Overall vs. subgroup proportion contribution:
         sex = Female sex = Male
Overall             0          0
Subgroup            1          1

 - - - - - - - Subgroup sex = Female - - - - - - -
- Weight ranges:
           Min                                   Max
treated 0.3626 |--------------------|         9.2546
control 0.6444  |--------------------------| 12.1700

- Units with 5 greatest weights by group:
                                           
           2177   1704   1626    806    765
 treated 5.8714 6.7055 7.3113 7.7407 9.2546
           1498   1415   1378    611    432
 control 5.3371 7.2264 7.5463 7.6013  12.17

          Ratio Coef of Var
treated 25.5239      0.9529
control 18.8869      0.6245
overall 33.5645      0.7508

- Effective Sample Sizes:
           Control Treated
Unweighted 1637.00  906.00
Weighted   1177.92  475.07

 - - - - - - - Subgroup sex = Male - - - - - - -
- Weight ranges:
           Min                                   Max
treated 0.4004 |---------------------------| 26.2701
control 0.5996  |-------|                     8.8109

- Units with 5 greatest weights by group:
                                            
           2719   2716   2474   1957    1064
 treated 6.4907 7.3707 8.2499 9.2112 26.2701
           2224   1672   1209    821     283
 control 6.3468 6.6169 7.8151  8.621  8.8109

          Ratio Coef of Var
treated 65.6135      1.1156
control 14.6941      0.6237
overall 65.6135      0.8532

- Effective Sample Sizes:
            Control  Treated
Unweighted 1914.000 1278.000
Weighted   1378.187  569.595

Checking PS distribution by subgroups

bal.plot(IPTW_sex, 
         cluster = "sex",
         which="both",
         type = "density",
         colors = c("red","blue"))

checking balance by subgroups

# checking balance by subgroups;
# bal.tab(IPTW_sex, cluster = "sex")
love.plot(IPTW_sex, 
          cluster = "sex", 
          grid = TRUE,
          stars = "std",
          thresholds = c(m = .1),
          colors = c("red","blue"))

fitting subgroup specific causal outcome models

fit2.f <- glm(Y ~ A, 
            family = "binomial",
            weights = IPTW_sex$weights[IPTW_sex$by=="Female"],
            data = subset(data2,sex=="Female"))
fit2.m <- glm(Y ~ A, 
            family = "binomial",
            weights = IPTW_sex$weights[IPTW_sex$by=="Male"],
            data = subset(data2,sex=="Male"))
tab_model(fit2.f, fit2.m)
  Y Y
Predictors Odds Ratios CI p Odds Ratios CI p
(Intercept) 0.41 0.37 – 0.46 <0.001 0.49 0.44 – 0.54 <0.001
A 1.48 1.24 – 1.76 <0.001 1.18 1.02 – 1.37 0.029
Observations 2543 3192
R2 Tjur 0.007 0.003

Sensitivity analysis for unmeasured confounding

References

Austin, Peter C. 2007. “Propensity-Score Matching in the Cardiovascular Surgery Literature from 2004 to 2006: A Systematic Review and Suggestions for Improvement.” The Journal of Thoracic and Cardiovascular Surgery 134 (5): 1128–35.
Austin, Peter C, Amy Ying Xin Yu, Manav V Vyas, and Moira K Kapral. 2021. “Applying Propensity Score Methods in Clinical Research in Neurology.” Neurology 97 (18): 856–63.
Dong, Jing, Junni L Zhang, Shuxi Zeng, and Fan Li. 2020. “Subgroup Balancing Propensity Score.” Statistical Methods in Medical Research 29 (3): 659–76.
Eeren, Hester V, Marieke D Spreeuwenberg, Anna Bartak, Mark de Rooij, and Jan JV Busschbach. 2015. “Estimating Subgroup Effects Using the Propensity Score Method: A Practical Application in Outcomes Research.” Medical Care 53 (4): 366–73.
Karim, Mohammad Ehsanul, Fabio Pellegrini, Robert W Platt, Gabrielle Simoneau, Julie Rouette, and Carl de Moor. 2022. “The Use and Quality of Reporting of Propensity Score Methods in Multiple Sclerosis Literature: A Review.” Multiple Sclerosis Journal 28 (9): 1317–23.
Wang, Shirley V, Yinzhu Jin, Bruce Fireman, Susan Gruber, Mengdong He, Richard Wyss, HoJin Shin, et al. 2018. “Relative Performance of Propensity Score Matching Strategies for Subgroup Analyses.” American Journal of Epidemiology 187 (8): 1799–1807.
Yang, Siyun, Elizabeth Lorenzi, Georgia Papadogeorgou, Daniel M Wojdyla, Fan Li, and Laine E Thomas. 2021. “Propensity Score Weighting for Causal Subgroup Analysis.” Statistics in Medicine 40 (19): 4294–4309.
Yao, Xiaoxin I, Xiaofei Wang, Paul J Speicher, E Shelley Hwang, Perry Cheng, David H Harpole, Mark F Berry, Deborah Schrag, and Herbert H Pang. 2017. “Reporting and Guidelines in Propensity Score Analysis: A Systematic Review of Cancer and Cancer Surgical Studies.” JNCI: Journal of the National Cancer Institute 109 (8): djw323.