A quick LCA example in R using poLCA package - from the package developer
Author
Kuan Liu
2000 National Election Studies survey
Survey data from the 2000 American National Election Study.
Two sets of six questions with four responses each, asking respondents’ opinions of how well various traits (moral, caring, knowledgable, good leader, dishonest, intelligent) describe presidential candidates Al Gore and George W. Bush.
The responses are (1) Extremely well; (2) Quite well; (3) Not too well; (4) Not well at all. Many respondents have varying numbers of missing values on these variables.
EDUC, the respondent’s level of education; (1) 8 grades or less; (2) 9-11 grades, no further schooling; (3) High school diploma or equivalency; (4) More than 12 years of schooling, no higher degree; (5) Junior or community college level degree; (6) BA level degrees, no advanced degree; (7) Advanced degree.
GENDER, the respondent’s gender; (1) Male; (2) Female.
A data frame with 1785 observations on 17 survey variables. Of these, 1311 individuals provided responses on all twelve candidate evaluations.
Source: The National Election Studies (https://electionstudies.org/). THE 2000 NATIONAL ELECTION STUDY [dataset]. Ann Arbor, MI: University of Michigan, Center for Political Studies
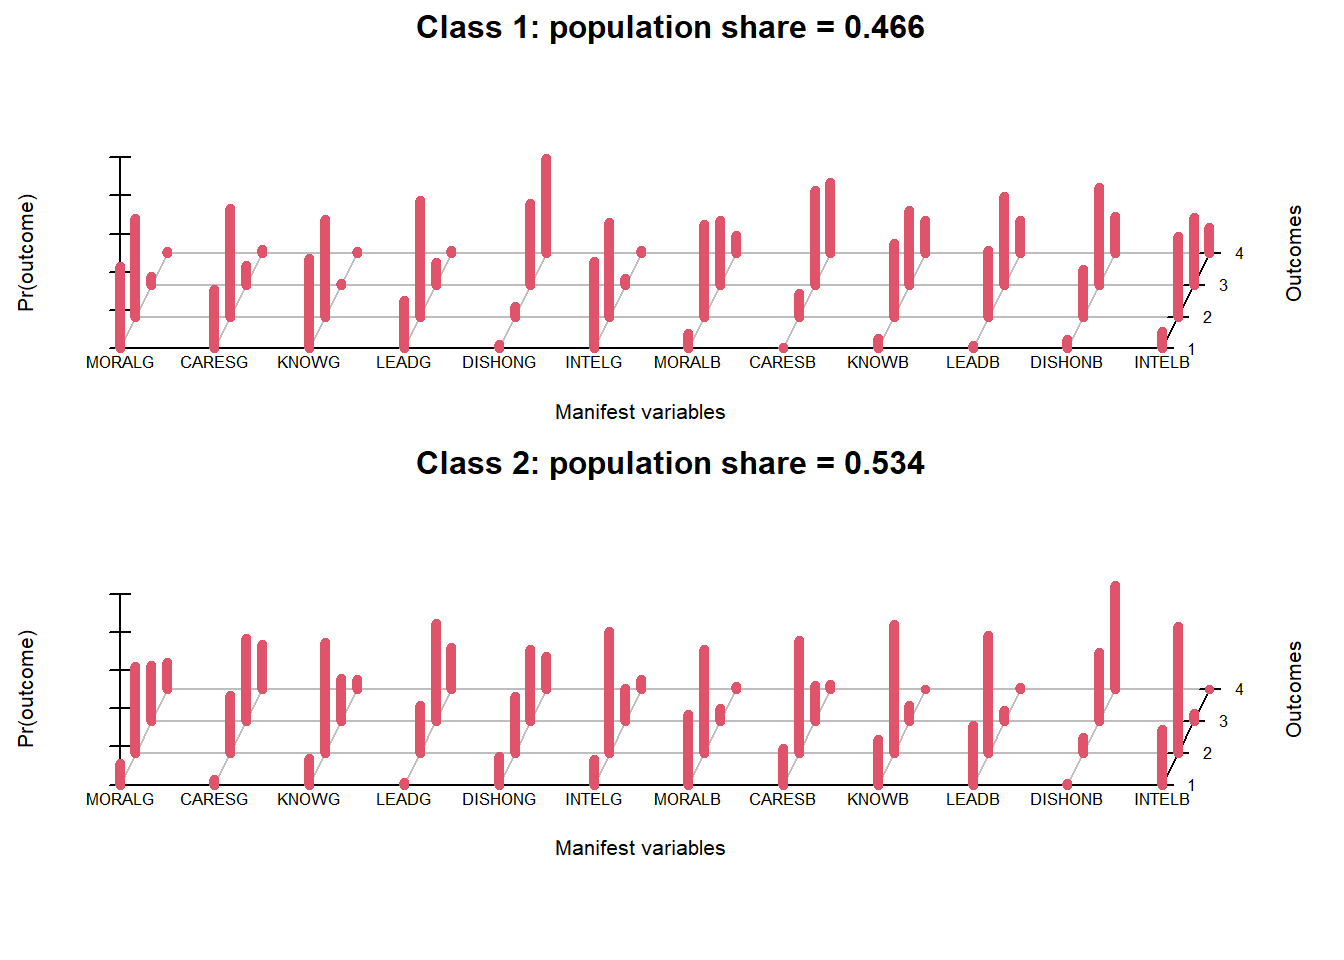
Conditional item response (column) probabilities,
 by outcome variable, for each class (row)

$MORALG
          1 Extremely well 2 Quite well 3 Not too well 4 Not well at all
class 1:            0.4334       0.5145         0.0446            0.0075
class 2:            0.1132       0.4533         0.2910            0.1425

$CARESG
          1 Extremely well 2 Quite well 3 Not too well 4 Not well at all
class 1:            0.3091       0.5685         0.1047            0.0177
class 2:            0.0280       0.3018         0.4323            0.2379

$KNOWG
          1 Extremely well 2 Quite well 3 Not too well 4 Not well at all
class 1:            0.4713       0.5095         0.0093            0.0098
class 2:            0.1397       0.5811         0.2260            0.0532

$LEADG
          1 Extremely well 2 Quite well 3 Not too well 4 Not well at all
class 1:            0.2547       0.6116         0.1199            0.0137
class 2:            0.0160       0.2513         0.5105            0.2222

$DISHONG
          1 Extremely well 2 Quite well 3 Not too well 4 Not well at all
class 1:            0.0204       0.0571         0.4274            0.4951
class 2:            0.1483       0.2992         0.3782            0.1743

$INTELG
          1 Extremely well 2 Quite well 3 Not too well 4 Not well at all
class 1:            0.4596       0.4941         0.0338            0.0125
class 2:            0.1371       0.6350         0.1728            0.0551

$MORALB
          1 Extremely well 2 Quite well 3 Not too well 4 Not well at all
class 1:            0.0788       0.4863         0.3397            0.0952
class 2:            0.3697       0.5439         0.0695            0.0169

$CARESB
          1 Extremely well 2 Quite well 3 Not too well 4 Not well at all
class 1:            0.0081       0.1238         0.4968            0.3712
class 2:            0.1930       0.5923         0.1898            0.0249

$KNOWB
          1 Extremely well 2 Quite well 3 Not too well 4 Not well at all
class 1:            0.0554       0.3843         0.3902            0.1701
class 2:            0.2369       0.6756         0.0849            0.0026

$LEADB
          1 Extremely well 2 Quite well 3 Not too well 4 Not well at all
class 1:            0.0199       0.3457         0.4628            0.1716
class 2:            0.3148       0.6177         0.0577            0.0098

$DISHONB
          1 Extremely well 2 Quite well 3 Not too well 4 Not well at all
class 1:            0.0471       0.2493         0.5086            0.1950
class 2:            0.0099       0.0846         0.3626            0.5429

$INTELB
          1 Extremely well 2 Quite well 3 Not too well 4 Not well at all
class 1:            0.0901       0.4196         0.3563             0.134
class 2:            0.2918       0.6639         0.0443             0.000

Estimated class population shares
 0.4663 0.5337

Predicted class memberships (by modal posterior prob.)
 0.4705 0.5295

=========================================================
Fit for 2 latent classes:
=========================================================
number of observations: 880
number of estimated parameters: 73
residual degrees of freedom: 807
maximum log-likelihood: -11352.91

AIC(2): 22851.82
BIC(2): 23200.76
G^2(2): 11011.59 (Likelihood ratio/deviance statistic)
X^2(2): 7146792388 (Chi-square goodness of fit)
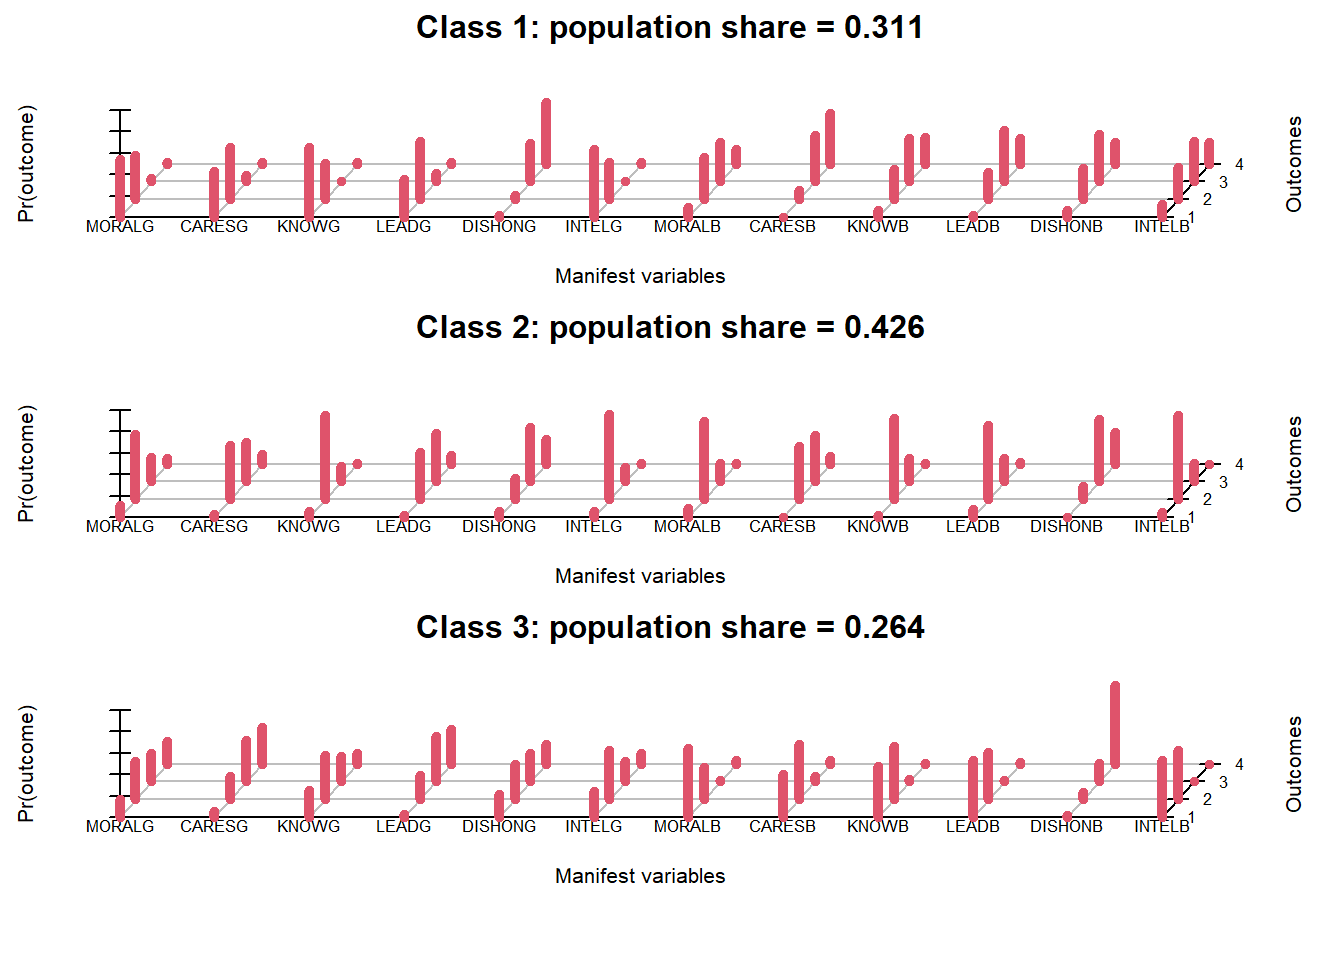
Conditional item response (column) probabilities,
 by outcome variable, for each class (row)

$MORALG
          1 Extremely well 2 Quite well 3 Not too well 4 Not well at all
class 1:            0.1134       0.6108         0.2278            0.0479
class 2:            0.1685       0.3582         0.2623            0.2111
class 3:            0.5468       0.4099         0.0321            0.0112

$CARESG
          1 Extremely well 2 Quite well 3 Not too well 4 Not well at all
class 1:            0.0260       0.5077         0.3726            0.0937
class 2:            0.0542       0.2182         0.3834            0.3443
class 3:            0.4308       0.4909         0.0637            0.0146

$KNOWG
          1 Extremely well 2 Quite well 3 Not too well 4 Not well at all
class 1:            0.0577       0.7852         0.1482            0.0089
class 2:            0.2515       0.4154         0.2347            0.0983
class 3:            0.6552       0.3344         0.0000            0.0104

$LEADG
          1 Extremely well 2 Quite well 3 Not too well 4 Not well at all
class 1:            0.0188       0.4459         0.4534            0.0819
class 2:            0.0292       0.2241         0.4224            0.3242
class 3:            0.3593       0.5486         0.0772            0.0150

$DISHONG
          1 Extremely well 2 Quite well 3 Not too well 4 Not well at all
class 1:            0.0565       0.2020         0.5130            0.2285
class 2:            0.2169       0.3326         0.2666            0.1838
class 3:            0.0238       0.0407         0.3620            0.5735

$INTELG
          1 Extremely well 2 Quite well 3 Not too well 4 Not well at all
class 1:            0.0587       0.7987         0.1343            0.0084
class 2:            0.2475       0.4615         0.1926            0.0984
class 3:            0.6352       0.3464         0.0000            0.0184

$MORALB
          1 Extremely well 2 Quite well 3 Not too well 4 Not well at all
class 1:            0.0803       0.7354         0.1762            0.0080
class 2:            0.6467       0.3045         0.0175            0.0312
class 3:            0.0945       0.3981         0.3729            0.1345

$CARESB
          1 Extremely well 2 Quite well 3 Not too well 4 Not well at all
class 1:            0.0000       0.4975         0.4307            0.0718
class 2:            0.3992       0.5170         0.0520            0.0317
class 3:            0.0050       0.0827         0.4375            0.4748

$KNOWB
          1 Extremely well 2 Quite well 3 Not too well 4 Not well at all
class 1:            0.0149       0.7579         0.2203            0.0069
class 2:            0.4767       0.4935         0.0250            0.0048
class 3:            0.0651       0.2799         0.4086            0.2464

$LEADB
          1 Extremely well 2 Quite well 3 Not too well 4 Not well at all
class 1:            0.0721       0.6893         0.2197            0.0190
class 2:            0.5295       0.4436         0.0168            0.0102
class 3:            0.0224       0.2591         0.4787            0.2398

$DISHONB
          1 Extremely well 2 Quite well 3 Not too well 4 Not well at all
class 1:            0.0051       0.1219         0.5795            0.2935
class 2:            0.0173       0.0699         0.1759            0.7369
class 3:            0.0662       0.2931         0.4430            0.1978

$INTELB
          1 Extremely well 2 Quite well 3 Not too well 4 Not well at all
class 1:            0.0445       0.7848         0.1706            0.0000
class 2:            0.5379       0.4621         0.0000            0.0000
class 3:            0.1189       0.3026         0.3772            0.2013

Estimated class population shares
 0.4258 0.2637 0.3105

Predicted class memberships (by modal posterior prob.)
 0.4284 0.2636 0.308

=========================================================
Fit for 3 latent classes:
=========================================================
number of observations: 880
number of estimated parameters: 110
residual degrees of freedom: 770
maximum log-likelihood: -10915.77

AIC(3): 22051.54
BIC(3): 22577.33
G^2(3): 10137.3 (Likelihood ratio/deviance statistic)
X^2(3): 3084645269 (Chi-square goodness of fit)