Survival Analysis in R Lab 2

1. Hands-on excerise fitting multistate Markov model for panel data

Panel data

  • State only observed at a finite number of times
  • The only data information that one needs is the number of all observed transitions between states and the total time at risk in each state, aggregated over all individuals
  • (intermittently-observed) don’t need to know the state between these times, e.g., managing chronic conditions at clinical visits
  • attractive modelling approach when handling large data sets.
  • msm package is developed for multistate modelling of panel data where the focus is on estimating transition probabilities between states.

1.1 Revisit Heart transplant monitoring data

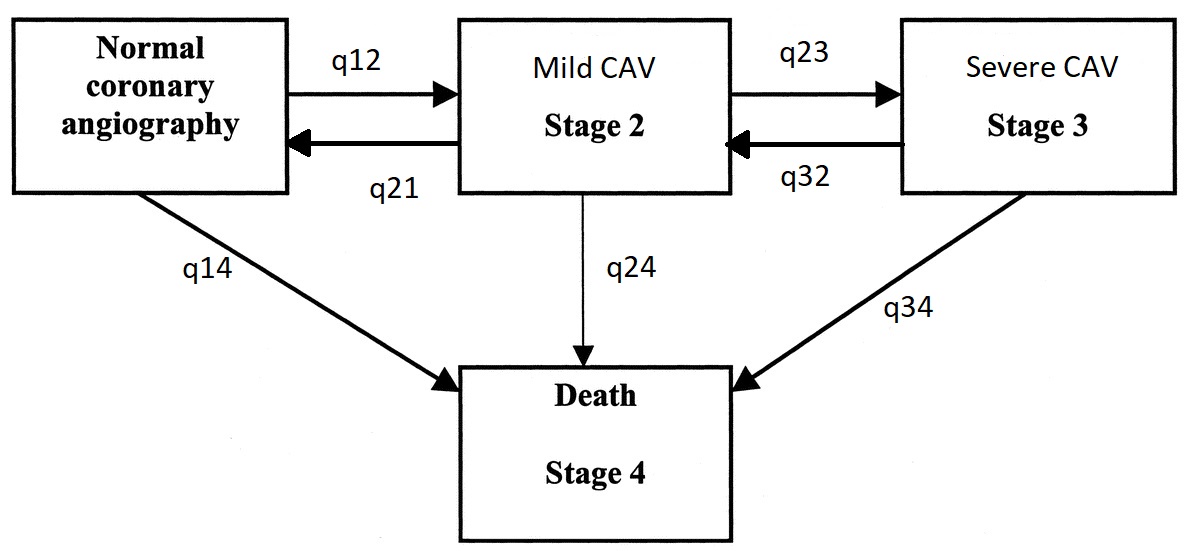
  • A series of approximately yearly angiographic examinations of heart transplant recipients. The state at each time is a grade of cardiac allograft vasculopathy (cav), a deterioration of the arterial walls.

  • A data frame containing 2846 rows.

  • There are 622 patients, the rows are grouped by patient number and ordered by years after transplant, with each row representing an examination and containing additional covariates.

  • PTNUM (numeric) Patient identification number

  • age (numeric) Recipient age at examination (years)

  • years (numeric) Examination time (years after transplant)

  • dage (numeric) Age of heart donor (years)

  • sex (numeric) sex (0=male, 1=female)

  • pdiag (factor) Primary diagnosis (reason for transplant)

    • IHD=ischaemic heart disease,
    • IDC=idiopathic dilated cardiomyopathy.
  • cumrej (numeric) Cumulative number of acute rejection episodes

  • state (numeric) State at the examination.

    • State 1 represents no CAV,
    • state 2 is mild/moderate CAV
    • and state 3 is severe CAV.
    • State 4 indicates death.
  • firstobs (numeric)

    • 0 = record represents an angiogram or date of death.
    • 1 = record represents transplant (patient’s first observation)
  • statemax (numeric) Maximum observed state so far for this patient

library(msm)
library(tidyverse)
library(gtsummary)
library(DT)
# View(cav)
# str(cav)

# look at the data;
datatable(cav,
          rownames = FALSE) %>%
  formatRound(columns=c('age','years'), digits=1)
# creating baseline table
cav_baseline <- cav %>% 
  arrange(PTNUM, years) %>%
  group_by(PTNUM) %>%
  slice_head(n=1) #keeping the first visit data for each subject;

subset(cav_baseline, select = c(age, sex, dage, pdiag)) %>% 
  tbl_summary(
  missing_text = "(Missing)")
Characteristic N = 6221
age 50 (42, 55)
sex 87 (14%)
dage 29 (20, 40)
pdiag
    CVCM 19 (3.1%)
    Hyper 3 (0.5%)
    IDC 270 (44%)
    IHD 313 (51%)
    Other 4 (0.7%)
    Restr 5 (0.8%)
    (Missing) 8
1 Median (IQR); n (%)

1.2 Multistate models

  • Study objectives:
    • Estimate transition intensity (TIM) and transition probability/risk functions (TPM)
    • identify association between risk factors and CAV progression and survival
  • Summarize observed transitions
statetable.msm(state, PTNUM, cav)
    to
from    1    2    3    4
   1 1367  204   44  148
   2   46  134   54   48
   3    4   13  107   55

  • Define allowed transition as a matrix of binary indicators
    • in this example, we do not allow transition from state 1 to 3 directly
    • we do observe 44 intervals with transition 1 to 3, we assume there is an unobserved passing transition 1->2->3.
  • The transition model following the hypothesized process

\[ Q = \left[\begin{array}{cccc} -(q_{12} + q_{14}) & q_{12} & 0 & q_{14} \\ q_{21} & -(q_{21}+q_{23}+q_{24}) & q_{23} & q_{24} \\ 0 & q_{32} & -(q_{32}+q_{34}) & q_{34} \\ 0 & 0 & 0 & 0 \end{array}\right] \]

#setting initial value;
Q <- rbind (
c(0, 0.25, 0, 0.25), #i.e., from state 1 we can transit to state 2 and 4;
c(0.166, 0, 0.166, 0.166),
c(0, 0.25, 0, 0.25),
c(0, 0, 0, 0))
Q
      [,1] [,2]  [,3]  [,4]
[1,] 0.000 0.25 0.000 0.250
[2,] 0.166 0.00 0.166 0.166
[3,] 0.000 0.25 0.000 0.250
[4,] 0.000 0.00 0.000 0.000
Q.crude <- crudeinits.msm(state ~ years, PTNUM, data=cav, qmatrix=Q)
Q.crude
           [,1]        [,2]       [,3]       [,4]
[1,] -0.1173149  0.06798932  0.0000000 0.04932559
[2,]  0.1168179 -0.37584883  0.1371340 0.12189692
[3,]  0.0000000  0.04908401 -0.2567471 0.20766310
[4,]  0.0000000  0.00000000  0.0000000 0.00000000

transition matrix from state 1 can be interpreted as, we expect on average 1/(0.25+0.25) = 2 years in state 1 and we assume equal chance from state 1 to transition to state 2 and 4.

1.3 Simple naive model

  • Model1: simple multistate model assuming no information on the exact time of state entry

1.2.1 TIM

# Model 1
heart.msm1 <- msm(state ~ years, subject=PTNUM, data=cav, qmatrix=Q.crude)
heart.msm1

Call:
msm(formula = state ~ years, subject = PTNUM, data = cav, qmatrix = Q.crude)

Maximum likelihood estimates

Transition intensities
                  Baseline                    
State 1 - State 1 -0.17471 (-0.19506,-0.15649)
State 1 - State 2  0.12607 ( 0.10968, 0.14491)
State 1 - State 4  0.04864 ( 0.04008, 0.05903)
State 2 - State 1  0.23789 ( 0.17790, 0.31810)
State 2 - State 2 -0.61885 (-0.72334,-0.52945)
State 2 - State 3  0.30508 ( 0.24457, 0.38056)
State 2 - State 4  0.07588 ( 0.04289, 0.13427)
State 3 - State 2  0.15067 ( 0.09222, 0.24616)
State 3 - State 3 -0.48506 (-0.61548,-0.38227)
State 3 - State 4  0.33439 ( 0.25533, 0.43794)

-2 * log-likelihood:  3986.087 
# Model estimated transition intensity matrix;
qmatrix <- qmatrix.msm(heart.msm1)
  • we see patients are three times as likely to transition from no CAV to mild CAV then death.
  • Once in mild CAV state, patients are more likely to progress to sever CAV than to no CAV.
  • Once in the severe state, death is more likely to occur.

1.2.2 Ratio of transition intensities

qratio.msm(heart.msm1, ind1=c(2,3), ind2=c(2,1))
 estimate        se         L         U 
1.2824682 0.2389993 0.8900567 1.8478877 
  • At state 2 (mild CAV), progress to state 3 (severe CAV) is 1.3 times more likely than recovery (no CAV).

1.2.3 Estimated mean time in each state

sojourn.msm(heart.msm1)
        estimates        SE        L        U
State 1  5.723630 0.3217075 5.126585 6.390207
State 2  1.615900 0.1286282 1.382475 1.888736
State 3  2.061599 0.2504859 1.624735 2.615929

The average amount of time a patient spends in the mild CAV state is 1.62 years (95% CI 1.38 to 1.89).

1.2.4 Transition probability matrix

# estimating the transition probability matrix at 5 years;
pmatrix.msm(heart.msm1, t=5, 
            ci = "norm")
        State 1                   State 2                  
State 1 0.51168 (0.47921,0.54361) 0.13235 (0.11481,0.15023)
State 2 0.24973 (0.19775,0.30527) 0.13272 (0.10469,0.16323)
State 3 0.06806 (0.04164,0.10878) 0.06938 (0.04343,0.10214)
State 4 0                         0                        
        State 3                   State 4                  
State 1 0.07304 (0.05928,0.08748) 0.28293 (0.25544,0.31529)
State 2 0.14048 (0.10734,0.17660) 0.47707 (0.42096,0.54102)
State 3 0.13737 (0.08854,0.19662) 0.72519 (0.63805,0.80712)
State 4 0                         1.00000 (1.00000,1.00000)
            # ci="bootstrap", cores = 5, B=1000)
  • For patients in state 1, at 5 years there is about 51% chances of staying in state 1.
  • For patients in state 3, at 5 years there is about 73% chances of being dead.

1.4 Model with covariates and exact death time

  • Assume exact death time is recorded, but not other state entry times (same covariates on all transition rates)

1.2.1 Fitting covariates

# Model 2
heart.msm2 <- msm(state ~ years, 
                  PTNUM, 
                  data=cav,
                  qmatrix=Q.crude, 
                  deathexact = 4,
                  covariates = ~ sex,
                  control=list(fnscale=5000))
# deathexact: Vector of indices of absorbing states whose time of entry is known exactly, but the individual is assumed to be in an unknown transient state ("alive") at the previous instant. This is the usual situation for times of death in chronic disease monitoring data. For example, if you specify deathexact = c(4) then states 4 is assumed to be exactly-observed death states;
# It is often worthwhile to normalize the optimisation using control=list(fnscale = a), where a is the a number of the order of magnitude of the -2 log likelihood;

heart.msm3 <- msm(state ~ years, 
                  PTNUM, 
                  data=cav,
                  qmatrix=Q.crude, 
                  deathexact = 4,
                  covariates = ~ sex + age,
                  control=list(fnscale=5000))

# example to compare covariates models;
logliks <- c(logLik(heart.msm1), logLik(heart.msm2), logLik(heart.msm3))
AICs <- AIC(heart.msm1, heart.msm2, heart.msm3)
cbind(logliks, AICs)
             logliks df      AIC
heart.msm1 -1993.044  7 4000.087
heart.msm2 -1977.649 14 3983.299
heart.msm3 -1960.507 21 3963.013
  • Model 3 is has the best fit.

1.2.2 Hazard Ratio of transition risk

hazard.msm(heart.msm3)
$sex
                         HR          L         U
State 1 - State 2 0.6599402 0.39500958  1.102558
State 1 - State 4 1.2583468 0.65425689  2.420206
State 2 - State 1 1.3602422 0.52150948  3.547891
State 2 - State 3 1.0581743 0.50005884  2.239202
State 2 - State 4 0.7770243 0.02933949 20.578640
State 3 - State 2 0.8375957 0.09833204  7.134668
State 3 - State 4 2.5174948 1.23111129  5.148016

$age
                         HR         L        U
State 1 - State 2 1.0117661 0.9985370 1.025170
State 1 - State 4 1.0618814 1.0302436 1.094491
State 2 - State 1 1.0219367 0.9902139 1.054676
State 2 - State 3 0.9786256 0.9557051 1.002096
State 2 - State 4 1.0341056 0.8700592 1.229082
State 3 - State 2 0.9543338 0.9073848 1.003712
State 3 - State 4 0.9916257 0.9659416 1.017993
  • For transition 3 to 4, female is at higher risk.
  • For patients in state 1, 1 unit increase in age is associated with 1.06 times of higher risk of death.

1.2.3 Estimating specific transition probabiliy by covariate

# estimating the transition probability matrix at 5 years;
pmatrix.msm(heart.msm1, t=5, 
            covariates = list(sex = 1, age = 65),
            ci = "norm") 
        State 1                   State 2                  
State 1 0.51168 (0.47812,0.54302) 0.13235 (0.11293,0.14952)
State 2 0.24973 (0.19634,0.30632) 0.13272 (0.10373,0.16332)
State 3 0.06806 (0.04166,0.10906) 0.06938 (0.04090,0.10365)
State 4 0                         0                        
        State 3                   State 4                  
State 1 0.07304 (0.05841,0.08772) 0.28293 (0.25606,0.31718)
State 2 0.14048 (0.10450,0.17413) 0.47707 (0.41974,0.54438)
State 3 0.13737 (0.08445,0.19476) 0.72519 (0.63477,0.81154)
State 4 0                         1.00000 (1.00000,1.00000)
# try at home, this takes a long time to run;
# pmatrix.msm(heart.msm1, t=5, 
#             covariates = list(sex = 1, age = 65),
#              ci="bootstrap", cores = 4, B=1000);
  • For a 65 year old female patient in state 1, at 5 years there is about 51% chances of staying in state 1 and about 28% chances of death.

1.2.4 Comparing expected times from state i to j in by age and sex

efpt.msm(heart.msm3, tostate = 4, 
         covariates = list(sex = 1, age = 65), ci = "norm")
           [,1]     [,2]      [,3] [,4]
est    7.147621 6.193303 1.9663185    0
2.5%   3.996213 1.804865 0.8314657    0
97.5% 11.389299 9.566610 5.0641788    0
efpt.msm(heart.msm3, tostate = 4, 
         covariates = list(sex = 0, age = 65), ci = "norm")
           [,1]     [,2]     [,3] [,4]
est    8.637568 7.791753 4.804326    0
2.5%   5.304905 2.294142 2.983020    0
97.5% 10.282852 9.397326 6.751089    0

1.2.5 Survival plots

plot(heart.msm3)
abline(h = 0.5,lwd = 1, lty = 4)

  • For patients in state 3, the median survival time is approximately 3 years.

1.5 Model diagnostics

  • (Goodness-of-fit) Checking if the model predicted transition events matches with the expected values using Pearson chi-square test.
# plot.prevalence.msm(heart.msm3, maxtime=5)
pearson.msm(heart.msm3)
Imputing sampling times after deaths...
Calculating replicates of test statistics for imputations...
$Observed
           Time Interval           Cov 1-1 1-2 1-3   1-4 2-1 2-2 2-3   2-4 3-1
1      [0,3.04)        1 [-2.67,-1.23)  71   3   5  5.81   1   9   2  0.71   0
2   [3.04,5.97)        1 [-2.67,-1.23)  53   5   1  0.00   1   4   5  0.23   0
3  [5.97,19.46]        1 [-2.67,-1.23)  48   4   2  0.70   4   7   3  0.62   0
4      [0,3.04)        2 [-2.67,-1.23)  66  12   0  6.36   0   0   0  0.71   0
5   [3.04,5.97)        2 [-2.67,-1.23)  67   3   0  0.61   3   2   3  0.33   1
6  [5.97,19.46]        2 [-2.67,-1.23)  53   8   1  1.01   3   5   1  0.57   0
7      [0,3.04)        3 [-2.67,-1.23)  72   6   1  7.83   0   0   0  0.58   0
8   [3.04,5.97)        3 [-2.67,-1.23)  45   7   0  6.39   1   3   0  0.44   0
9  [5.97,19.46]        3 [-2.67,-1.23)  40   9   2 13.29   0   5   1  7.81   1
10     [0,3.04)        1 [-1.23,-1.18)  55   8   3  7.44   3   2   1  0.34   0
11  [3.04,5.97)        1 [-1.23,-1.18)  46   5   0  0.85   4   8   3  0.00   0
12 [5.97,19.46]        1 [-1.23,-1.18)  22   9   0  0.89   3   8   3  0.86   0
13     [0,3.04)        2 [-1.23,-1.18)  64   4   5  9.19   0   0   0  0.37   0
14  [3.04,5.97)        2 [-1.23,-1.18)  45   5   2  3.18   2   5   1  0.40   1
15 [5.97,19.46]        2 [-1.23,-1.18)  27   9   2  1.30   5   7   5  1.29   0
16     [0,3.04)        3 [-1.23,-1.18)  57   7   2  9.37   0   0   0  0.29   0
17  [3.04,5.97)        3 [-1.23,-1.18)  71  13   3  7.97   1   1   0  0.60   0
18 [5.97,19.46]        3 [-1.23,-1.18)  44  12   2 17.81   4   9   4  8.85   0
19     [0,3.04)        1 [-1.18,-1.18]  34   4   4  5.95   2   5   3  0.31   0
20  [3.04,5.97)        1 [-1.18,-1.18]  41   5   0  2.29   2  11   6  0.91   0
21 [5.97,19.46]        1 [-1.18,-1.18]  36  10   0  0.21   0  13   3  0.87   0
22     [0,3.04)        2 [-1.18,-1.18]  58   9   0  7.05   0   0   0  0.34   0
23  [3.04,5.97)        2 [-1.18,-1.18]  50   8   0  3.40   2   6   2  2.43   0
24 [5.97,19.46]        2 [-1.18,-1.18]  38   5   0  0.32   4   9   4  1.31   0
25     [0,3.04)        3 [-1.18,-1.18]  68  11   4  7.00   0   0   0  0.35   0
26  [3.04,5.97)        3 [-1.18,-1.18]  63  10   4  7.31   0   4   0  4.66   0
27 [5.97,19.46]        3 [-1.18,-1.18]  33  13   1 14.47   1  11   4 11.82   1
   3-2 3-3   3-4
1    1   0  0.29
2    0   7  1.27
3    0   1  1.19
4    0   0  0.43
5    1   3  1.62
6    0   4  1.96
7    0   0  0.28
8    0   0  2.11
9    1   2  8.85
10   1   6  0.00
11   0  11  0.77
12   2  16  0.62
13   0   0  0.00
14   0   6  1.22
15   0   8  1.05
16   0   0  0.00
17   0   0  1.01
18   0   3  9.33
19   0   0  0.33
20   1   7  1.54
21   3  11  0.75
22   0   0  0.32
23   0   9  1.94
24   2   8  1.11
25   0   0  0.35
26   0   1  3.52
27   1   4 13.14

$Expected
           Time Interval           Cov      1-1       1-2       1-3       1-4
1      [0,3.04)        1 [-2.67,-1.23) 74.05177  6.616312 1.4639694  2.677947
2   [3.04,5.97)        1 [-2.67,-1.23) 52.24885  4.307707 0.8026938  1.640747
3  [5.97,19.46]        1 [-2.67,-1.23) 48.65682  3.680960 0.6765573  1.685664
4      [0,3.04)        2 [-2.67,-1.23) 67.02902  8.733767 3.0277089  5.569508
5   [3.04,5.97)        2 [-2.67,-1.23) 58.74323  6.589033 1.9995010  3.278233
6  [5.97,19.46]        2 [-2.67,-1.23) 55.69988  4.750788 1.0180102  1.541320
7      [0,3.04)        3 [-2.67,-1.23) 67.04219  9.221839 3.3180511  7.247925
8   [3.04,5.97)        3 [-2.67,-1.23) 43.20125  6.056701 2.3512390  6.780809
9  [5.97,19.46]        3 [-2.67,-1.23) 43.11933  6.404403 2.7247599 12.041505
10     [0,3.04)        1 [-1.23,-1.18) 60.57599  7.510260 1.4313291  3.922422
11  [3.04,5.97)        1 [-1.23,-1.18) 44.02685  4.798657 0.7315440  2.292947
12 [5.97,19.46]        1 [-1.23,-1.18) 27.16172  2.935606 0.4425947  1.350083
13     [0,3.04)        2 [-1.23,-1.18) 59.75320 11.219458 3.4245201  7.792820
14  [3.04,5.97)        2 [-1.23,-1.18) 43.02934  6.477083 1.5277469  4.145826
15 [5.97,19.46]        2 [-1.23,-1.18) 33.00984  3.838002 0.6296341  1.822526
16     [0,3.04)        3 [-1.23,-1.18) 53.08015 10.573966 3.3897288  8.326158
17  [3.04,5.97)        3 [-1.23,-1.18) 64.21008 13.466797 4.5421453 12.750973
18 [5.97,19.46]        3 [-1.23,-1.18) 43.56505  9.691617 3.9719163 18.581421
19     [0,3.04)        1 [-1.18,-1.18] 38.73797  5.060565 0.9312605  3.220204
20  [3.04,5.97)        1 [-1.18,-1.18] 40.10284  4.784137 0.6800069  2.723015
21 [5.97,19.46]        1 [-1.18,-1.18] 38.41906  4.540196 0.6317683  2.618972
22     [0,3.04)        2 [-1.18,-1.18] 51.88232 10.456258 2.9646960  8.746730
23  [3.04,5.97)        2 [-1.18,-1.18] 45.56718  7.887168 1.9092111  6.036441
24 [5.97,19.46]        2 [-1.18,-1.18] 35.51349  4.466857 0.6654886  2.674160
25     [0,3.04)        3 [-1.18,-1.18] 61.69355 12.942237 3.9000854 11.464132
26  [3.04,5.97)        3 [-1.18,-1.18] 56.84569 12.155585 3.8839511 11.424777
27 [5.97,19.46]        3 [-1.18,-1.18] 36.05665  7.952943 3.0252570 14.435151
         2-1        2-2       2-3        2-4        3-1       3-2        3-3
1  1.6317399  7.4351326 2.7042112 0.93891634 0.02312984 0.2733127  0.6590107
2  1.4817427  5.5808539 2.2645814 0.90282205 0.10501716 0.9871498  4.2934970
3  1.8033482  8.4446607 3.3741341 0.99785694 0.02198233 0.1828409  1.1483509
4  0.0000000  0.0000000 0.0000000 0.12092619 0.00000000 0.0000000  0.0000000
5  1.6102811  3.7084029 1.7333879 1.27792814 0.11517585 0.8749667  3.3464223
6  1.4157210  5.1963470 2.1490733 0.80885875 0.07638416 0.6648411  3.4806057
7  0.0000000  0.0000000 0.0000000 0.11079617 0.00000000 0.0000000  0.0000000
8  0.9271600  1.4812277 1.0980972 0.93351511 0.00000000 0.0000000  0.0000000
9  2.3595297  3.1415860 2.5374415 5.77144284 0.41864340 1.1782635  3.6394042
10 1.0404244  3.7239932 1.1390229 0.43655950 0.06805836 0.5079541  4.7920071
11 2.3698262  8.7268480 2.8679476 1.03537822 0.09207382 0.7413062  8.4693732
12 2.3617773  8.6196760 2.8568519 1.02169471 0.15289720 1.2211345 13.2495404
13 0.0000000  0.0000000 0.0000000 0.05993384 0.00000000 0.0000000  0.0000000
14 1.6650537  4.1354716 1.7159807 0.88349399 0.11312194 0.6687883  5.1602284
15 3.1693392 10.2211493 3.4936878 1.40582364 0.09027176 0.6425057  6.1658861
16 0.0000000  0.0000000 0.0000000 0.05154747 0.00000000 0.0000000  0.0000000
17 0.6560755  0.7662214 0.6017355 0.57596757 0.00000000 0.0000000  0.0000000
18 5.8199080  7.3576566 5.3161671 7.35626828 0.29442401 0.5739395  3.4409707
19 1.8269313  5.9335260 1.7924018 0.75714091 0.00000000 0.0000000  0.0000000
20 3.3746005 11.7688599 3.3978178 1.36872181 0.07628530 0.5782209  6.8309911
21 2.8030183 10.0270778 2.9048379 1.13506597 0.11256170 0.8592001 10.7167848
22 0.0000000  0.0000000 0.0000000 0.05558019 0.00000000 0.0000000  0.0000000
23 2.5381885  6.1037905 2.4772539 1.31076703 0.11997235 0.6958693  7.3441264
24 3.3605485 10.2285390 3.2849835 1.43592902 0.10236267 0.7058432  7.7211550
25 0.0000000  0.0000000 0.0000000 0.06114298 0.00000000 0.0000000  0.0000000
26 2.2032215  2.6232691 1.9871937 1.84631574 0.14721791 0.3411589  1.8614578
27 5.8174336  8.1405872 5.1387847 8.72319452 0.52954716 0.9912128  5.3526154
           3-4
1   0.33454677
2   2.88433604
3   0.83682584
4   0.17390731
5   2.28343517
6   1.73816904
7   0.11753160
8   1.16089527
9   7.61368893
10  1.63198051
11  2.46724687
12  3.99642789
13  0.00000000
14  2.27786128
15  2.15133644
16  0.00000000
17  0.45523693
18  8.02066579
19  0.08017778
20  2.05450268
21  3.06145343
22  0.12529543
23  2.78003195
24  2.58063922
25  0.14535989
26  2.17016531
27 12.26662469

$`Deviance*sign(O-E)`
           Time Interval           Cov         1-1          1-2           1-3
1      [0,3.04)        1 [-2.67,-1.23) -0.16423758 -1.977313411  8.5502610339
2   [3.04,5.97)        1 [-2.67,-1.23)  0.01079874  0.111258782  0.0484988822
3  [5.97,19.46]        1 [-2.67,-1.23) -0.01551366  0.028340986  2.5897981547
4      [0,3.04)        2 [-2.67,-1.23) -0.04439835  1.228806911 -3.0277088580
5   [3.04,5.97)        2 [-2.67,-1.23)  1.16653117 -1.955002362 -1.9995010107
6  [5.97,19.46]        2 [-2.67,-1.23) -0.13943641  2.224524936 -0.0004711214
7      [0,3.04)        3 [-2.67,-1.23)  0.41234457 -1.128038780 -1.6196240790
8   [3.04,5.97)        3 [-2.67,-1.23)  0.08132819  0.147503889 -2.3512389501
9  [5.97,19.46]        3 [-2.67,-1.23) -0.23850507  1.059855278 -0.1951555153
10     [0,3.04)        1 [-1.23,-1.18) -0.55718387  0.040904394  1.7272948833
11  [3.04,5.97)        1 [-1.23,-1.18)  0.09912596  0.009536803 -0.7315439823
12 [5.97,19.46]        1 [-1.23,-1.18) -0.99329354 12.550722121 -0.4425947286
13     [0,3.04)        2 [-1.23,-1.18)  0.36338918 -4.646912873  0.7313943389
14  [3.04,5.97)        2 [-1.23,-1.18)  0.11526717 -0.339525446  0.1482803657
15 [5.97,19.46]        2 [-1.23,-1.18) -1.10777478  6.957609810  2.9862999458
16     [0,3.04)        3 [-1.23,-1.18)  0.35049751 -1.212793667 -0.5710013361
17  [3.04,5.97)        3 [-1.23,-1.18)  0.73276281 -0.018805015 -0.5241997415
18 [5.97,19.46]        3 [-1.23,-1.18)  0.02057383  0.556555505 -0.9803984516
19     [0,3.04)        1 [-1.18,-1.18] -0.63735182 -0.228611134 10.1465360187
20  [3.04,5.97)        1 [-1.18,-1.18]  0.04590535  0.012959408 -0.6800069231
21 [5.97,19.46]        1 [-1.18,-1.18] -0.15482677  6.567415747 -0.6317682763
22     [0,3.04)        2 [-1.18,-1.18]  0.77364964 -0.209196343 -2.9646960064
23  [3.04,5.97)        2 [-1.18,-1.18]  0.46928007  0.007206145 -1.9092110670
24 [5.97,19.46]        2 [-1.18,-1.18]  0.17856831  0.064318011 -0.6654885931
25     [0,3.04)        3 [-1.18,-1.18]  0.68482732 -0.296562518  0.0048236784
26  [3.04,5.97)        3 [-1.18,-1.18]  0.69320175 -0.385578307  0.0054429594
27 [5.97,19.46]        3 [-1.18,-1.18] -0.26969130  3.214601723 -1.3564010417
           1-4         2-1         2-2          2-3        2-4         3-1
1   4.88286808 -0.24672182  0.36282753 -0.190041672 -0.5789265 -0.02312984
2  -1.64074673 -0.15796524 -0.45207174  3.318230997 -0.6743123 -0.10501716
3  -0.82228575  2.68742839 -0.25957589 -0.049031485 -0.5684312 -0.02198233
4   0.58413707  0.00000000  0.00000000  0.000000000  2.8724504  0.00000000
5  -2.28381277  1.21897768 -0.78980957  0.939202950 -0.8510445  7.32695777
6  -0.60799649  1.78515094 -0.02743944 -0.617198201 -0.4846052 -0.07638416
7   0.55327001  0.00000000  0.00000000  0.000000000  2.0268963  0.00000000
8  -0.07018776  0.02361824  1.60764570 -1.098097189 -0.4502790  0.00000000
9   0.22365371 -2.35952971  1.17777607 -0.936058420  0.8618092  0.91065238
10  4.11760493  3.73820344 -0.80320306 -0.023279451 -0.4528354 -0.06805836
11 -1.15642713  1.12137613 -0.06053824  0.006080251 -1.0353782 -0.09207382
12 -0.66449458  0.18618295 -0.06974121  0.016600643 -0.6638871 -0.15289720
13  0.86865177  0.00000000  0.00000000  0.000000000  1.6044959  0.00000000
14 -0.58954004  0.07681190  0.19467564 -0.301475451 -0.4972787  7.19668039
15 -0.64772690  1.08026313 -1.02929904  0.670934246 -0.6144641 -0.09027176
16  0.65419711  0.00000000  0.00000000  0.000000000  1.1233037  0.00000000
17 -1.90699584  0.23300619  0.13707998 -0.601735549  0.2985456  0.00000000
18 -0.09640277 -0.58090158  0.40242410 -0.336021776  0.4807609 -0.29442401
19  3.37324999  0.02084843 -0.15398033  0.827119313 -0.5165300  0.00000000
20 -0.54737817 -0.56143503 -0.06276425  2.006984289 -0.4829533 -0.07628530
21 -2.27750317 -2.80301828  0.91688280  0.010472642 -0.5502738 -0.11256170
22 -0.74526546  0.00000000  0.00000000  0.000000000  1.4557010  0.00000000
23 -1.53419506 -0.13607996 -0.04817426 -0.113314188  1.6724086 -0.11997235
24 -2.15151494  0.13200871 -0.16699823  0.168744673 -0.5015740 -0.10236267
25 -2.06228494  0.00000000  0.00000000  0.000000000  1.3738682  0.00000000
26 -1.68463414 -2.20322150  0.90436082 -1.987193651  4.6553833 -0.14721791
27  0.05986566 -3.99005676  1.04697038 -0.263581421  1.2665704  0.46446942
           3-2         3-3         3-4
1   2.17136970 -0.65901069 -0.30524592
2  -0.98714985  1.84655475 -1.11224789
3  -0.18284095 -0.29187276  0.54726296
4   0.00000000  0.00000000  0.37716718
5   0.04550899 -0.07149747 -0.38780266
6  -0.66484111  0.20892846  0.30504516
7   0.00000000  0.00000000  0.22558317
8   0.00000000  0.00000000  0.87743953
9  -0.04311962 -0.76019673  0.26212414
10  0.47663601  0.30451686 -1.63198051
11 -0.74130615  0.81830234 -1.40019048
12  0.49921266  0.59281486 -2.93961196
13  0.00000000  0.00000000  0.00000000
14 -0.66878834  0.19379201 -0.69520183
15 -0.64250575  0.63109992 -0.79445957
16  0.00000000  0.00000000  0.00000000
17  0.00000000  0.00000000  0.72716121
18 -0.57393953 -0.10860964  0.25612252
19  0.00000000  0.00000000  0.87246995
20  0.32664741  0.08003343 -0.46027786
21  5.36207616  0.03441272 -1.90153668
22  0.00000000  0.00000000  0.30262312
23 -0.69586928  0.47994604 -0.57486720
24  2.40274879  0.05392650 -1.04329083
25  0.00000000  0.00000000  0.29144530
26 -0.34115893 -0.45233000  0.92036942
27  0.01082770 -0.36965252  0.09771876

$test
     stat df.lower p.lower df.upper    p.upper
 282.6954       NA      NA      237 0.02234694
  • The p-value suggest the model doesn’t fit well.

2. Hands-on excerise fitting multistate COX model for time-to-event data with complete observed transition times

  • using R packages survival and mstate and mvna, package references from the developer:
  • data contains complete information on state changes
    • know the complete process history and event times, i.e., changes of state represent events
  • can estimate transition rates under more flexible models, such as COX semi-Markov model.

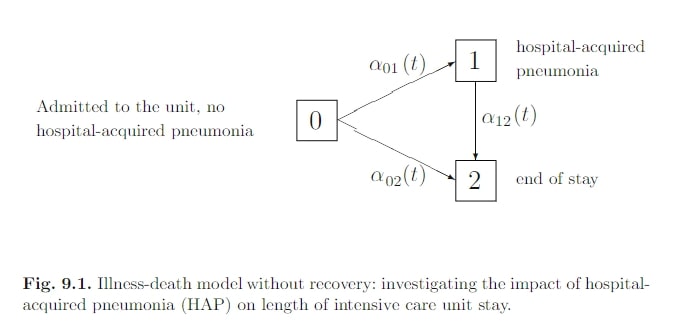
2.1 Hospital acquired penumonia in ICU (illness death model)

  • This data set is a random sample drawn from the SIR-3 study that aimed at analyzing the effect of nosocomial infections on the length of ICU stay.

  • Patients were included in the study if they had stayed at least 1 day in the unit. The sample includes information to assess the effect of nosocomial pneumonia on the length of stay.

  • The endpoint is either discharge alive from the ICU or dead in the unit. These data are censoring complete as the censoring time is known for all patients.

  • Beyersmann, J., Gastmeier, P., Grundmann, H., Baerwolff, S., Geffers, C., Behnke, M., Rueden, H., and Schumacher, M. Use of multistate models to assess prolongation of intensive care unit stay due to nosocomial infection. Infection Control and Hospital Epidemiology, 27:493-499, 2006.

  • A data frame with 1421 observations on the following 8 variables.

    • id
    • start, Start of the observation time.
    • stop, Failure time.
    • status, Censoring status.
    • event, 2 is death in ICU, 3 is discharge alive
    • pneu, Nosocomial pneumonia indicator.
    • adm.cens.exit, Exit times for patients discharged alive are replaced by their administrative censoring times.
    • age, Age at inclusion
    • sex, F for female and M for male

library(survival)
library(mstate)
library(mvna) #non-parametric analysis;
library(kmi) #getting data;

data("icu.pneu")

# look at the data;
datatable(icu.pneu,
          rownames = FALSE) %>%
  formatRound(columns=c('age'), digits=1)

2.2 Non-parametric analysis

library(lattice)
# manipulate orignal data to fit the illness-death model;
my.icu.pneu <- icu.pneu %>%
           group_by(id) %>%
            mutate(leadpneu = lead(pneu)) %>%
            mutate(from = case_when(
              start ==0 ~ 0,
              start >0 & pneu ==1 ~ 1),
              to = case_when(
                from ==0 & leadpneu==1 ~ 1,
                from ==0 & is.na(leadpneu) & event ==2 ~ 2,
                from ==0 & is.na(leadpneu) & event ==3 ~ 3,
                from ==0 & leadpneu==0 & event ==2 ~ 2,
                from ==0 & leadpneu==0 & event ==3 ~ 3,
                from ==1 & event == 2 ~ 2,
                from ==1 & event == 3 ~ 3)) %>%
  select(-leadpneu, -adm.cens.exit, - pneu) %>%
  rename(entry = start, exit = stop)

# Matrix of logical indicating the possible transitions;
# state 0 admission, 1 hospital acquired penumonia,
# 2, death, 3 discharge alive;
tra <- matrix(ncol=4,nrow=4,FALSE)
tra[1,2:4] <- TRUE
tra[2,3:4] <- TRUE
tra
      [,1]  [,2]  [,3]  [,4]
[1,] FALSE  TRUE  TRUE  TRUE
[2,] FALSE FALSE  TRUE  TRUE
[3,] FALSE FALSE FALSE FALSE
[4,] FALSE FALSE FALSE FALSE
# Nelson-Aalen estimator of cumulative transition hazards
pneu <- mvna(my.icu.pneu, c("0", "1", "2","3"), tra, cens.name = NULL)
pneu
Transition 0 -> 1 
   na var.aalen var.greenwood time
 0.00      0.00          0.00    0
 0.13      0.00          0.00   17
 0.20      0.00          0.00   35
 0.22      0.00          0.00   54
 0.34      0.02          0.01   71
 0.34      0.02          0.01   96

Transition 0 -> 2 
   na var.aalen var.greenwood time
 0.00      0.00          0.00    0
 0.13      0.00          0.00   17
 0.32      0.00          0.00   35
 0.44      0.00          0.00   54
 0.79      0.03          0.03   71
 1.29      0.28          0.15   96

Transition 0 -> 3 
   na var.aalen var.greenwood time
 0.00      0.00          0.00    0
 1.25      0.00          0.00   17
 2.18      0.01          0.01   35
 3.29      0.04          0.03   54
 3.98      0.09          0.09   71
 4.93      0.34          0.26   96

Transition 1 -> 2 
   na var.aalen var.greenwood time
 0.00      0.00          0.00    4
 0.13      0.00          0.00   19
 0.25      0.01          0.01   35
 0.39      0.01          0.01   52
 0.66      0.05          0.04   63
 1.24      0.22          0.16   81

Transition 1 -> 3 
   na var.aalen var.greenwood time
 0.00      0.00          0.00    4
 0.39      0.01          0.01   19
 1.32      0.03          0.03   35
 1.99      0.07          0.06   52
 2.53      0.13          0.11   63
 2.98      0.23          0.19   81
xyplot(pneu,
        tr.choice=c("0 2","1 2","0 3","1 3"),
        aspect=1,
        strip=strip.custom(bg="white",
                           factor.levels= c("No pneumonia - Death","Pneumonia - Death","No pneumonia - Discharge","Pneumonia - Discharge"),par.strip.text=list(cex=0.9)), scales=list(alternating=1),xlab="Days", ylab="Nelson-Aalen estimates")

# estimating transition probabilities using etm package;
# Aalen-Johansen estimator;
library(etm)
pneu.etm <- etm(my.icu.pneu, c("0", "1", "2","3"), tra, cens.name = NULL, s = 0) #s is the starting state for probability calculation;

summary(pneu.etm)
Transition 0 0 
           P time          var        lower       upper n.risk n.event
 0.999238385    1 5.796151e-07 0.9977462167 1.000000000   1313       0
 0.187357197   18 1.159592e-04 0.1662514484 0.208462946    265       0
 0.055597867   36 3.998990e-05 0.0432035312 0.067992204     78       0
 0.015993907   54 1.198637e-05 0.0092082500 0.022779564     23       0
 0.004569688   71 3.464437e-06 0.0009216072 0.008217768      8       0
 0.000000000  460 0.000000e+00 0.0000000000 0.000000000      1       0

Transition 0 1 
           P time          var        lower       upper n.risk n.event
 0.000000000    1 0.000000e+00 0.000000e+00 0.000000000   1313       0
 0.051028180   18 3.688066e-05 3.912543e-02 0.062930933    265       0
 0.020563595   36 1.533948e-05 1.288727e-02 0.028239920     78       0
 0.009139375   54 6.897066e-06 3.992066e-03 0.014286685     23       0
 0.003046458   71 2.313159e-06 6.553506e-05 0.006027382      8       1
 0.000000000  460 0.000000e+00 0.000000e+00 0.000000000      1       0

Transition 0 2 
          P time          var      lower      upper n.risk n.event
 0.00000000    1 0.000000e+00 0.00000000 0.00000000   1313       0
 0.07006855   18 4.962600e-05 0.05626144 0.08387565    265       1
 0.09672506   36 6.654175e-05 0.08073702 0.11271310     78       0
 0.10357959   54 7.071657e-05 0.08709764 0.12006154     23       0
 0.10967251   71 7.436744e-05 0.09277045 0.12657456      8       0
 0.11195735  460 7.572194e-05 0.09490207 0.12901263      1       0

Transition 0 3 
            P time          var     lower       upper n.risk n.event
 0.0007616146    1 5.796151e-07 0.0000000 0.002253783   1313       1
 0.6915460777   18 1.624601e-04 0.6665644 0.716527746    265      18
 0.8271134806   36 1.089084e-04 0.8066595 0.847567508     78       5
 0.8712871287   54 8.541193e-05 0.8531734 0.889400837     23       2
 0.8827113481   71 7.885150e-05 0.8653072 0.900115509      8       1
 0.8880426504  460 7.572194e-05 0.8709874 0.905097934      1       1

Transition 1 1 
          P time          var      lower      upper n.risk n.event
 1.00000000    1 0.0000000000 1.00000000 1.00000000      0       0
 0.62231062   18 0.0034982409 0.50638673 0.73823451     72       0
 0.19637809   36 0.0014274534 0.12232741 0.27042877     27       0
 0.08416204   54 0.0005994829 0.03617362 0.13215046     12       0
 0.02104051   71 0.0001481434 0.00000000 0.04489605      4       0
 0.00000000  460 0.0000000000 0.00000000 0.00000000      0       0

Transition 1 2 
          P time         var      lower     upper n.risk n.event
 0.00000000    1 0.000000000 0.00000000 0.0000000      0       0
 0.08523632   18 0.001749435 0.00325837 0.1672143     72       1
 0.15369166   36 0.002061832 0.06469478 0.2426885     27       0
 0.17473217   54 0.002119916 0.08449044 0.2649739     12       0
 0.19577268   71 0.002179151 0.10427886 0.2872665      4       1
 0.20629293  460 0.002199978 0.11436294 0.2982229      0       0

Transition 1 3 
         P time         var     lower     upper n.risk n.event
 0.0000000    1 0.000000000 0.0000000 0.0000000      0       0
 0.2924531   18 0.002958697 0.1858430 0.3990632     72       4
 0.6499303   36 0.002648728 0.5490592 0.7508014     27       0
 0.7411058   54 0.002363766 0.6458151 0.8363964     12       0
 0.7831868   71 0.002239538 0.6904340 0.8759397      4       0
 0.7937071  460 0.002199978 0.7017771 0.8856371      0       0
par(mfrow=c(2,2))
plot(pneu.etm, tr.choice = "0 1", conf.int = TRUE,lwd = 2, legend = FALSE, ylim = c(0, 0.1),xlim = c(0, 100), xlab = "Days", ci.fun = "cloglog")
plot(pneu.etm, tr.choice = "0 2", conf.int = TRUE,lwd = 2, legend = FALSE, ylim = c(0, 0.1),xlim = c(0, 100), xlab = "Days", ci.fun = "cloglog")
plot(pneu.etm, tr.choice = "1 2", conf.int = TRUE,lwd = 2, legend = FALSE, ylim = c(0, 0.1),xlim = c(0, 100), xlab = "Days", ci.fun = "cloglog")
plot(pneu.etm, tr.choice = "1 3", conf.int = TRUE,lwd = 2, legend = FALSE, ylim = c(0, 0.1),xlim = c(0, 100), xlab = "Days", ci.fun = "cloglog")

  • shows that the proportion of hospital infected patients increases for about the first 20 days after admission and then decreases again.

2.3 Proportional transition hazards models

my.icu.pneu <- my.icu.pneu %>%
  mutate(trans = case_when(
    from == 0 & to ==1 ~ 1,
    from == 0 & to ==2 ~ 2,
    from == 0 & to ==3 ~ 3,
    from == 1 & to ==2 ~ 4,
    from == 1 & to ==3 ~ 5,
  ),
  event2 = case_when(
    to == 3 ~ 0,
    to == 1 ~ 1,
    to == 2 ~ 2
  ))


trans1 <- coxph(Surv(entry,exit,as.factor(event2)) ~ age+sex,id=id, method="breslow", subset=(from==0),data=my.icu.pneu)

summary(trans1) # 1:2 is from state 0 to state 1 (penumonia); 1:3 is from stat 0 to state 3 (death)
Call:
coxph(formula = Surv(entry, exit, as.factor(event2)) ~ age + 
    sex, data = my.icu.pneu, subset = (from == 0), method = "breslow", 
    id = id)

  n= 1313, number of events= 234 

             coef exp(coef) se(coef) robust se     z Pr(>|z|)    
age_1:2  0.007921  1.007952 0.005632  0.005506 1.439    0.150    
sexM_1:2 0.209017  1.232466 0.201121  0.202138 1.034    0.301    
age_1:3  0.022675  1.022934 0.005732  0.005634 4.025 5.71e-05 ***
sexM_1:3 0.109237  1.115427 0.184914  0.182553 0.598    0.550    
---
Signif. codes:  0 '***' 0.001 '**' 0.01 '*' 0.05 '.' 0.1 ' ' 1

         exp(coef) exp(-coef) lower .95 upper .95
age_1:2      1.008     0.9921    0.9971     1.019
sexM_1:2     1.232     0.8114    0.8293     1.832
age_1:3      1.023     0.9776    1.0117     1.034
sexM_1:3     1.115     0.8965    0.7799     1.595

Concordance= 0.571  (se = 0.022 )
Likelihood ratio test= 20.32  on 4 df,   p=4e-04
Wald test            = 18.89  on 4 df,   p=8e-04
Score (logrank) test = 18.82  on 4 df,   p=9e-04,   Robust = 20.63  p=4e-04

  (Note: the likelihood ratio and score tests assume independence of
     observations within a cluster, the Wald and robust score tests do not).
trans2 <- coxph(Surv(entry,exit,as.factor(event2)) ~ age+sex,id=id, method="breslow", subset=(from==1),data=my.icu.pneu)

summary(trans2) # from stat 1 (penumonia) to state 3 (death);
Call:
coxph(formula = Surv(entry, exit, as.factor(event2)) ~ age + 
    sex, data = my.icu.pneu, subset = (from == 1), method = "breslow", 
    id = id)

  n= 108, number of events= 21 

         coef exp(coef) se(coef) robust se      z Pr(>|z|)
age  -0.01251   0.98757  0.01589   0.01408 -0.888    0.374
sexM -0.62746   0.53395  0.44016   0.41133 -1.525    0.127

     exp(coef) exp(-coef) lower .95 upper .95
age     0.9876      1.013    0.9607     1.015
sexM    0.5339      1.873    0.2384     1.196

Concordance= 0.614  (se = 0.073 )
Likelihood ratio test= 2.71  on 2 df,   p=0.3
Wald test            = 4.03  on 2 df,   p=0.1
Score (logrank) test = 2.86  on 2 df,   p=0.2,   Robust = 3.1  p=0.2

  (Note: the likelihood ratio and score tests assume independence of
     observations within a cluster, the Wald and robust score tests do not).
# follow similar model diagnostics;

3. Quick discussion

From (Meira-Machado et al. 2009)

  • A multi-state model (MSM) is a model for a continuous time stochastic process allowing individuals to move among a finite number of states.
  • In an MSM, the transition intensities provide the hazards for movement from one state to another.

Different model assumptions can be made about the dependence of the transition rates on time.

  1. Time homogeneous models: the intensities are constant over time
  2. Markov models: the transition intensities only depend on the history of the process through the current state.
    • Because of their simplicity, Markov models have been most frequently used.
    • modelling movements of patients between units of a hospital or between stages of a disease, or in the prediction of the incidence rate of diseases
  3. Semi-Markov models (an extension of markov models): future evolution depends on the current state and the entry time into state that state. Future probability transitions depend on the sojourn time (the time spent in the current state), and the clock of each sojourn time is reset to zero after each transition into a new state.
    • some aspects of systems’ behaviour cannot be captured by Markov processes. For instance, the risk of chronic diseases such as AIDS essentially depends on the time since infection.
    • SMP has been used for predicting a disease progression and recovery progress of patients with a specific type of disease.
    • illness-death model is a three-state SMP.

References

Meira-Machado, Luı́s, Jacobo de Uña-Álvarez, Carmen Cadarso-Suárez, and Per K Andersen. 2009. “Multi-State Models for the Analysis of Time-to-Event Data.” Statistical Methods in Medical Research 18 (2): 195–222.